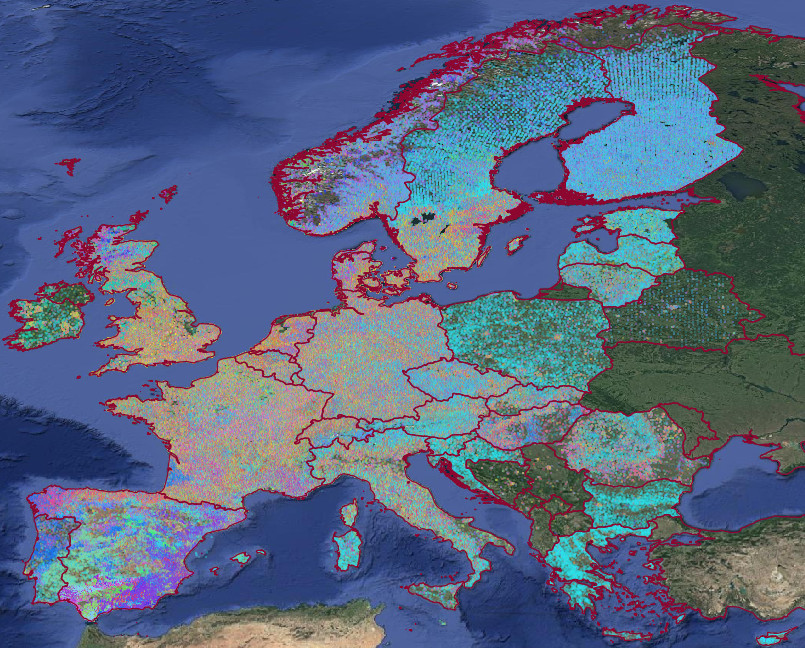
Environmental quality maps
Type of resources
Available actions
Topics
Keywords
Contact for the resource
Provided by
Formats
Representation types
Update frequencies
status
Resolution
-
pm2.5: Monthly PM2.5 maps aggregated from the daily PM2.5 predictions.
-
pm2.5: Number of pixels used in aggregating monthly PM2.5 maps.
-

Harmonized tree species occurrence points (field observations) for Europe is a harmonized collection of existing data from GBIF, the EU-Forest project and the LUCAS survey. It has about 3 million observations and is supplemented by variables (e.g. location accuracy, land cover type, canopy height, etc.) which enable precise filtering for specific user applications. The data can be obtained from: https://doi.org/10.5281/zenodo.4061816
-
Overview: Aerosol Optical Depth (AOD) at 550 nm Traceability (lineage): The data source used to generate this dataset are daily Aerosol Optical Depth (AOD) at 550 nm with 1 km spatial resolution from the MCD19A2 product of MODIS collection 6 for the years 2018-2020 (https://lpdaac.usgs.gov/products/mcd19a2v006/), daily modeled AOD at 550 nm with 80 km spatial resolution from Copernicus Atmosphere Monitoring Service (CAMS) for the years 2018-2020, and elevations from the worldwide digital surface model of the Japan Aerospace Exploration Agency (JAXA) (https://www.eorc.jaxa.jp/ALOS/). NASA’s Aerosols Robotic Network (AERONET) ground measurements were used to validate this dataset. Scientific methodology: The outcome of the scheme was a geo-harmonized atmospheric dataset for aerosol optical depth (GHADA) at 550 nm with 1 km spatial resolution and full coverage over Europe. Daily AOD maps were created by training an optimized space-time extra trees model for each year 2018-2020. The results have shown that our trained models reach a prediction accuracy up to 95% when predicting the missing values in the MODIS MCD19A2 product. Usability: AOD maps can be used for future air quality studies concerning Europe. Uncertainty quantification: nan Data validation approaches: GHADA was validated using AOD measurements from AERONET stations across Europe. Completeness: The raster files cover the entire Geo-harmonizer region. Consistency: nan Positional accuracy: 1 km spatial resolution Temporal accuracy: Daily maps for 3 years, 2018-2020. Thematic accuracy: nan
 Open Data Science Europe Metadata Catalog