 Open Data Science Europe Metadata Catalog
Rift Valley Fever
Type of resources
Available actions
Topics
Keywords
Contact for the resource
Provided by
Formats
Representation types
Update frequencies
status
Resolution
-
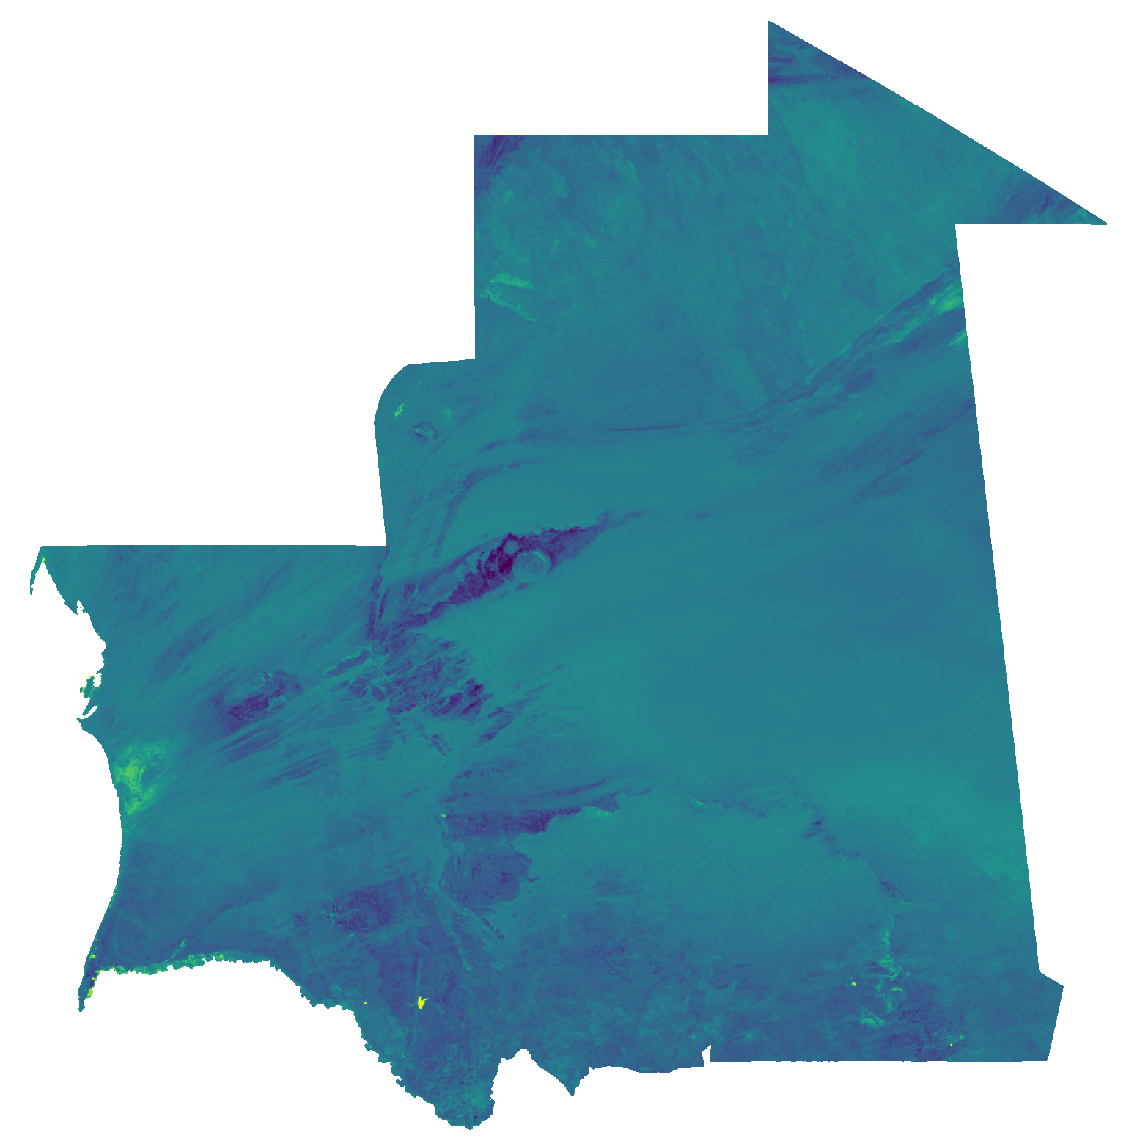
Normalized Difference Water Index (NDWI) from MODIS data for Mauritania at 30 arc seconds (ca. 1000 meter) resolution (2019 - 2023). Source data: - MODIS/Terra Surface Reflectance 8-Day L3 Global 500 m SIN Grid (MOD09A1 v061): https://lpdaac.usgs.gov/products/mod09a1v061/ The Moderate Resolution Imaging Spectroradiometer (MODIS) Terra MOD09A1 Version 6.1 product provides an estimate of the surface spectral reflectance of Terra MODIS Bands 1 through 7 corrected for atmospheric conditions such as gasses, aerosols, and Rayleigh scattering. Along with the seven 500 meter (m) reflectance bands are two quality layers and four observation bands. For each pixel, a value is selected from all the acquisitions within the 8-day composite period. The criteria for the pixel choice include cloud and solar zenith. When several acquisitions meet the criteria the pixel with the minimum channel 3 (blue) value is used. For the time period January 2019 - December 2023, the NDWI has been calculated from the Terra MOD09A1 Version 6.1 product. The layers B02 (near infrared) and B06 (shortwave infrared) of the original data have been processed. Bad quality pixels or pixels with snow/ice and/or cloud cover have been masked using the provided quality assurance (QA) layer. The time series has been gapfilled with a temporal and a spatial approach. Gaps in the time series were filled with a harmonic analysis of time series using six frequencies to also model relatively short-term changes in NDWI. Only missing values were replaced by modelled values. NDWI was calculated as the normalized difference of the bands B02 (near infrared) and B06 (shortwave infrared) with: NDWI = (B02 – B06) / (B02 + B06). This NDWI represents vegetation water content. The 8-day data are then aggregated to monthly temporal resolution using the average and reprojected to Latitude-Longitude/WGS84. File naming: ndwi_monthly_YYYY_MM_30arcsec.tif e.g.: ndwi_monthly_2023_12_30arcsec.tif The date within the filename are year and month of aggregated timestamp. Pixel values: Raster values are in the range [0, 2000]. Real NDWI in the range [-1, 1] can be retrieved with: NDWI = raster_value * 0.001 - 1. Projection + EPSG code: Latitude-Longitude/WGS84 (EPSG: 4326) Spatial extent: north: 28N south: 14N west: 18W east: 4W Temporal extent: January 2019 - December 2023 Spatial resolution: 30 arc seconds (approx. 1000 m) Temporal resolution: monthly Software used: GRASS GIS 8.3.2 Format: GeoTIFF Original dataset license: All data products distributed by NASA's Land Processes Distributed Active Archive Center (LP DAAC) are available at no charge. The LP DAAC requests that any author using NASA data products in their work provide credit for the data, and any assistance provided by the LP DAAC, in the data section of the paper, the acknowledgement section, and/or as a reference. The recommended citation for each data product is available on its Digital Object Identifier (DOI) Landing page, which can be accessed through the Search Data Catalog interface. For more information see: https://lpdaac.usgs.gov/products/mod13a2v061/ Processed by: mundialis GmbH & Co. KG, Germany (https://www.mundialis.de/) Contact: mundialis GmbH & Co. KG, info@mundialis.de Acknowledgements: This study was partially funded by EU grant 874850 MOOD. The contents of this publication are the sole responsibility of the authors and don't necessarily reflect the views of the European Commission.
-
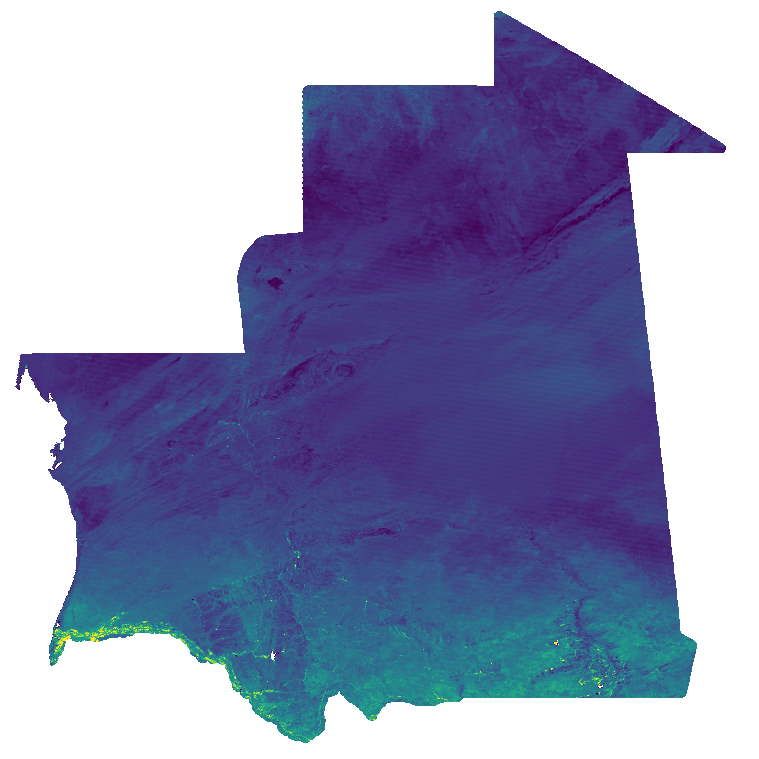
Normalized Difference Vegetation Index (NDVI) from MODIS data for Mauritania at 30 arc seconds (ca. 1000 meter) resolution (2019 - 2023). Source data: - MODIS/Terra Vegetation Indices 16-Day L3 Global 1 km SIN Grid (MOD13A2 v061): https://lpdaac.usgs.gov/products/mod13a2v061/ The Terra Moderate Resolution Imaging Spectroradiometer (MODIS) Vegetation Indices 16-Day (MOD13A2) Version 6.1 product provides Vegetation Index (VI) values at a per pixel basis at 1 kilometer (km) spatial resolution. There are two primary vegetation layers. The first is the Normalized Difference Vegetation Index (NDVI), which is referred to as the continuity index to the existing National Oceanic and Atmospheric Administration-Advanced Very High Resolution Radiometer (NOAA-AVHRR) derived NDVI. The second vegetation layer is the Enhanced Vegetation Index (EVI), which has improved sensitivity over high biomass regions. The algorithm for this product chooses the best available pixel value from all the acquisitions from the 16 day period. The criteria used is low clouds, low view angle and the highest NDVI/EVI value. For the time period January 2019 - December 2023, the NDVI layer of the original data has been processed. Bad quality pixels or pixels with snow/ice and/or cloud cover have been masked using the provided quality assurance (QA) layers and appear as "no data". These 16-Day data are then aggregated to monthly temporal resolution using the maximum and reprojected to Latitude-Longitude/WGS84. File naming: ndvi_filt_YYYY_MM_01T00_00_00.tif e.g.: ndvi_filt_2023_12_01T00_00_00.tif The date within the filename is year and month of aggregated timestamp. Pixel values: NDVI * 10000 Scaled to Integer, example: value 6473 = 0.6473 Projection + EPSG code: Latitude-Longitude/WGS84 (EPSG: 4326) Spatial extent: north: 28N south: 14N west: 18W east: 4W Temporal extent: January 2019 - December 2023 Spatial resolution: 30 arc seconds (approx. 1000 m) Temporal resolution: monthly Software used: GRASS GIS 8.3.2 Format: GeoTIFF Original dataset license: All data products distributed by NASA's Land Processes Distributed Active Archive Center (LP DAAC) are available at no charge. The LP DAAC requests that any author using NASA data products in their work provide credit for the data, and any assistance provided by the LP DAAC, in the data section of the paper, the acknowledgement section, and/or as a reference. The recommended citation for each data product is available on its Digital Object Identifier (DOI) Landing page, which can be accessed through the Search Data Catalog interface. For more information see: https://lpdaac.usgs.gov/products/mod13a2v061/ Processed by: mundialis GmbH & Co. KG, Germany (https://www.mundialis.de/) Contact: mundialis GmbH & Co. KG, info@mundialis.de Acknowledgements: This study was partially funded by EU grant 874850 MOOD. The contents of this publication are the sole responsibility of the authors and don't necessarily reflect the views of the European Commission.
-

Land Surface Temperature (LST) from MODIS data for Mauritania at 30 arc seconds (ca. 1000 meter) resolution (2019 - 2023). Source data: - MODIS/Terra Land Surface Temperature/Emissivity 8-Day L3 Global 1 km SIN Grid (MOD11A2 v061): https://lpdaac.usgs.gov/products/mod11a2v061/ The Terra Moderate Resolution Imaging Spectroradiometer (MODIS) Land Surface Temperature/Emissivity 8-Day (MOD11A2) Version 6.1 product provides an average 8-day per-pixel Land Surface Temperature and Emissivity (LST&E) with a 1 kilometer (km) spatial resolution in a 1,200 by 1,200 km grid. Each pixel value in the MOD11A2 is a simple average of all the corresponding MOD11A1 LST pixels collected within that 8-day period. The 8-day compositing period was chosen because twice that period is the exact ground track repeat period of the Terra and Aqua platforms. For the time period January 2019 - December 2023, the LST layer of the original data has been processed. Both day (10:30 am) and night (10:30 pm) overpasses have been processed separately. Bad quality pixels or pixels with snow/ice and/or cloud cover have been masked using the provided quality assurance (QA) layers. The time series has been gapfilled with a temporal and a spatial approach. Gaps in the time series were filled with a harmonic analysis of time series using six frequencies to also model relatively short-term changes in LST. Only missing values were replaced by modelled values. The 8-day data are then aggregated to monthly temporal resolution using the average and reprojected to Latitude-Longitude/WGS84. File naming: lst_day/night_monthly_YYYY_MM_30arcsec.tif e.g.: lst_day_monthly_2023_12_30arcsec.tif The date within the filename are year and month of aggregated timestamp. Pixel values: LST * 10 Scaled to Integer, example: value 327 = 32.7 Units are degree Celsius. Projection + EPSG code: Latitude-Longitude/WGS84 (EPSG: 4326) Spatial extent: north: 28N south: 14N west: 18W east: 4W Temporal extent: January 2019 - December 2023 Spatial resolution: 30 arc seconds (approx. 1000 m) Temporal resolution: monthly Software used: GRASS GIS 8.3.2 Format: GeoTIFF Original dataset license: All data products distributed by NASA's Land Processes Distributed Active Archive Center (LP DAAC) are available at no charge. The LP DAAC requests that any author using NASA data products in their work provide credit for the data, and any assistance provided by the LP DAAC, in the data section of the paper, the acknowledgement section, and/or as a reference. The recommended citation for each data product is available on its Digital Object Identifier (DOI) Landing page, which can be accessed through the Search Data Catalog interface. For more information see: https://lpdaac.usgs.gov/products/mod13a2v061/ Processed by: mundialis GmbH & Co. KG, Germany (https://www.mundialis.de/) Contact: mundialis GmbH & Co. KG, info@mundialis.de Acknowledgements: This study was partially funded by EU grant 874850 MOOD. The contents of this publication are the sole responsibility of the authors and don't necessarily reflect the views of the European Commission.