 Open Data Science Europe Metadata Catalog
Health
Type of resources
Available actions
Topics
Keywords
Contact for the resource
Provided by
Formats
Representation types
Update frequencies
status
Scale
Resolution
-

Overview: The Essential Climate Variables for assessment of climate variability from 1979 to present dataset contains a selection of climatologies, monthly anomalies and monthly mean fields of Essential Climate Variables (ECVs) suitable for monitoring and assessment of climate variability and change. Selection criteria are based on accuracy and temporal consistency on monthly to decadal time scales. The ECV data products in this set have been estimated from climate reanalyses ERA-Interim and ERA5, and, depending on the source, may have been adjusted to account for biases and other known deficiencies. Data sources and adjustment methods used are described in the Product User Guide, as are various particulars such as the baseline periods used to calculate monthly climatologies and the corresponding anomalies. Surface air relative humidity: The ratio of the partial pressure of water vapour to the equilibrium vapour pressure of water at the same temperature near the surface. Spatial resolution: 0:15:00 (0.25°) Temporal resolution: monthly Temporal extent: 1979 - present Data unit: percent * 10 Data type: UInt8 CRS as EPSG: EPSG:4326 Processing time delay: one month
-
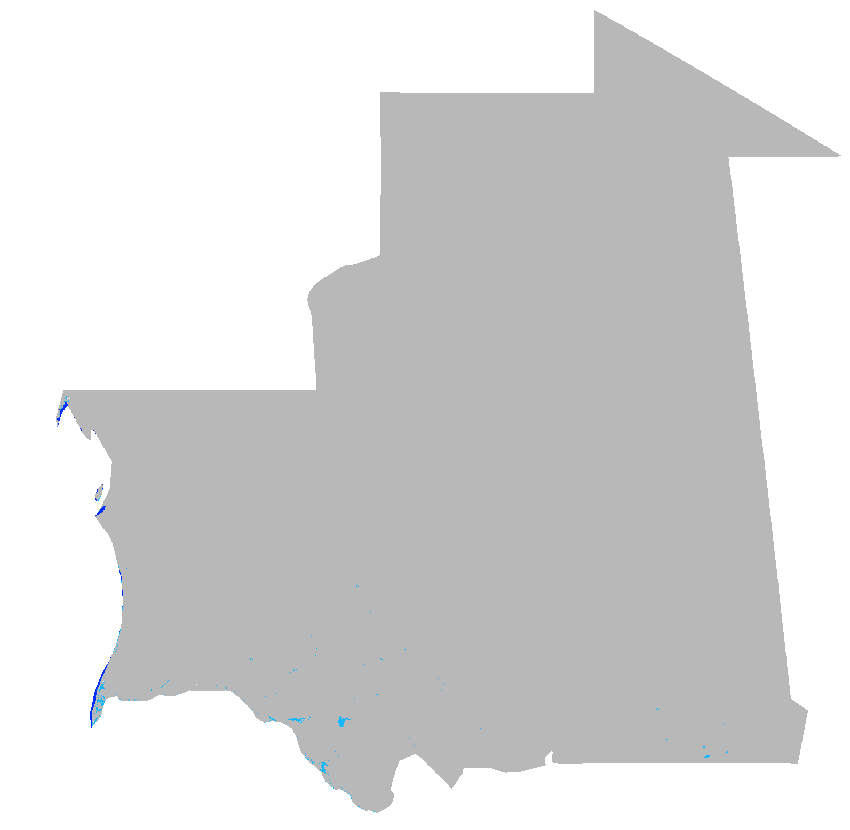
Water Bodies from Copernicus Land Monitoring Service (CLMS) as monthly time series for Mauritania at 30 arc seconds (ca. 1000 meter) resolution (2019 - 2023) Source data: - CLMS: Water Bodies 2014-2020 (raster 300 m), global, 10-daily – version 1: https://land.copernicus.eu/en/products/water-bodies/water-bodies-global-v1-0-300m - CLMS: Water Bodies 2020-present (raster 300 m), global, monthly – version 2: https://land.copernicus.eu/en/products/water-bodies/water-bodies-global-v2-0-300m Water is fundamental to life on Earth. Water quality, including aspects like turbidity and trophic state, is vital for assessing a water body's ecological well-being and its suitability for drinking. Understanding the water's surface temperature is key for monitoring climate change and can influence weather patterns. Tracking water levels in lakes and rivers helps in flood prediction, irrigation planning, and hydroelectric power generation. The presence and extent of ice on lakes and rivers can have significant implications for regional climates, ecosystems, and human activities. Moreover, the surface extent of water bodies, whether permanent or ephemeral, informs land management across various sectors. In an era marked by environmental change, these metrics offer insights into sustainable water resource management. The Water Bodies product group aims to address these critical issues by providing tailored datasets to users which are applicable across a wide array of sectors. It includes Lake Surface Water Temperature, providing real-time and historical data; Lake Water Quality in various resolutions; Water Bodies datasets for surface extent; Lake and River Water Level information; the River and Lake Ice Extent product for ice presence; and the Aggregated River and Lake Ice Extent product, showing percent ice coverage. These products support applications like food security, public health safeguarding, climate studies, and responsible water management practices. Processing steps: To cover the complete time period from 2019 to 2023 two data products of the Water Bodies product group are processed. Up to December of 2020 the Water Bodies at 10-daily resolution have been used, from January 2021 the Water Bodies at monthly resolution have been used. Both original datasets have been downloaded for the area of Mauritania (NUTS MR) within Latitude-Longitude/WGS84 spatial reference system. Then both datasets have been downsampled to 30 arc seconds (ca. 1000 meter) using the most frequent occuring value. The 10-daily data have been aggregated to monthly resolution using the most frequent occurring value. File naming: Until December 2020: c_gls_WB300_GLOBE_PROBAV_V1.0.1_MR_WB_res_YYYY_MM_01T00_00_00.tif e.g.: c_gls_WB300_GLOBE_PROBAV_V1.0.1_MR_WB_res_2020_12_01T00_00_00.tif From January 2021 on: c_gls_WB300_GLOBE_S2_V2.0.1_MR_WB_res_YYYY_MM_01T00_00_00.tif e.g.: c_gls_WB300_GLOBE_S2_V2.0.1_MR_WB_res_2023_12_01T00_00_00.tif The date within the filename is year and month of aggregated timestamp. NOTE: data for 2023-04 are missing, since they are not available from CLMS Pixel values: 0: Sea 70: Water 255: No water Projection + EPSG code: Latitude-Longitude/WGS84 (EPSG: 4326) Spatial extent: north: 27:17:30N south: 14:43:30N west: 17:04:30W east: 04:48:00W Temporal extent: January 2019 - December 2023 (except: April 2023) Spatial resolution: 30 arc seconds (approx. 1000 m) Temporal resolution: monthly Software used: GRASS GIS 8.3.2 Format: GeoTIFF Original dataset license: Generated using European Union's Copernicus Land Monitoring Service information Processed by: mundialis GmbH & Co. KG, Germany (https://www.mundialis.de/) Contact: mundialis GmbH & Co. KG, info@mundialis.de Acknowledgements: This study was partially funded by EU grant 874850 MOOD. The contents of this publication are the sole responsibility of the authors and don't necessarily reflect the views of the European Commission.
-

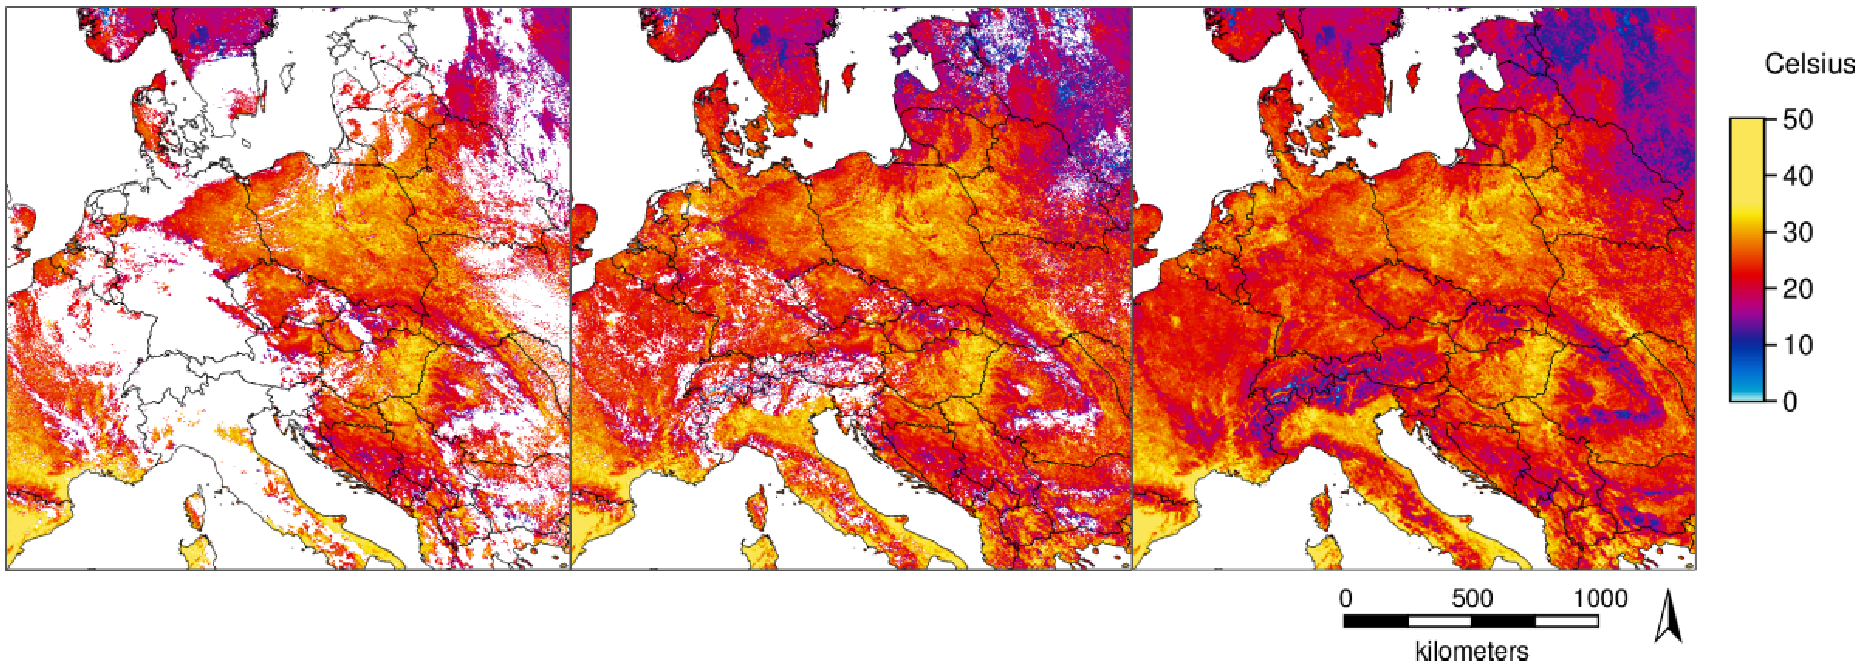
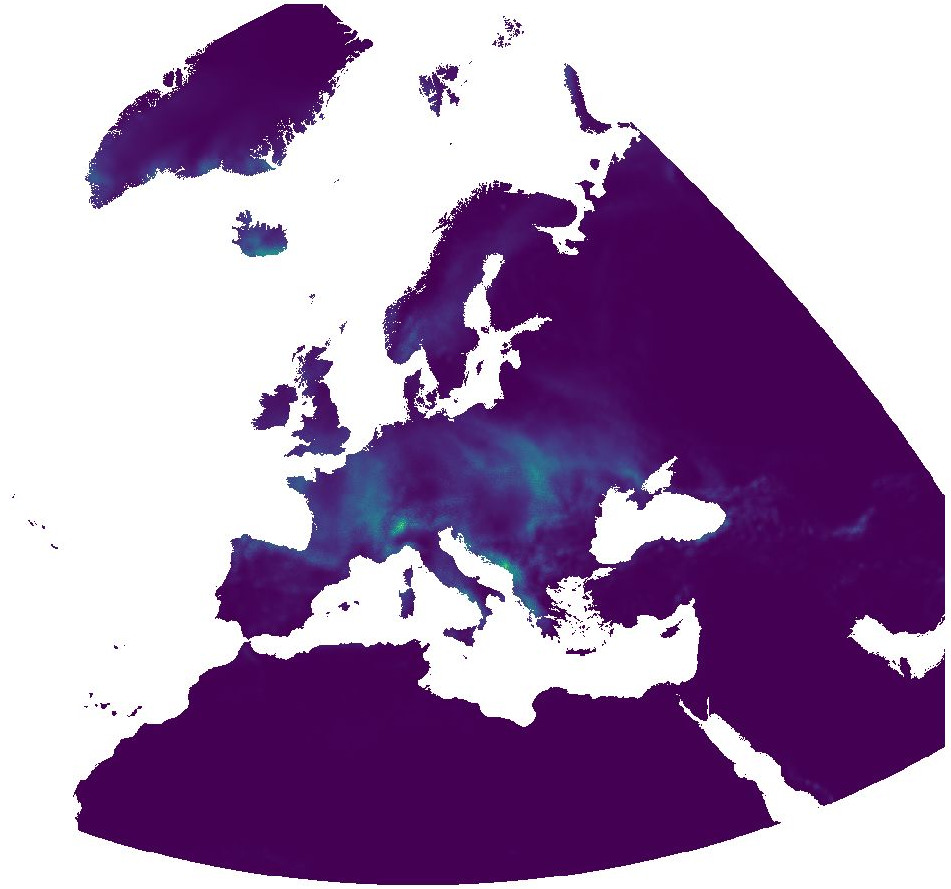
Temperature time series with high spatial and temporal resolutions are important for several applications. The new MODIS Land Surface Temperature (LST) collection 6 provides numerous improvements compared to collection 5. However, being remotely sensed data in the thermal range, LST shows gaps in cloud-covered areas. With a novel method [1] we fully reconstructed the daily global MODIS LST products MOD11C1 and MYD11C1 (spatial resolution: 3 arc-min, i.e. approximately 5.6 km at the equator). For this, we combined temporal and spatial interpolation, using emissivity and elevation as covariates for the spatial interpolation. Here we provide a time series of these reconstructed LST data aggregated as monthly average, minimum and maximum LST maps. [1] Metz M., Andreo V., Neteler M. (2017): A new fully gap-free time series of Land Surface Temperature from MODIS LST data. Remote Sensing, 9(12):1333. DOI: http://dx.doi.org/10.3390/rs9121333 The data available here for download are the reconstructed global MODIS LST products MOD11C1/MYD11C1 at a spatial resolution of 3 arc-min (approximately 5.6 km at the equator; see https://lpdaac.usgs.gov/dataset_discovery/modis/modis_products_table), aggregated to monthly data. The data are provided in GeoTIFF format. The Coordinate Reference System (CRS) is identical to the MOD11C1/MYD11C1 product as provided by NASA. In WKT as reported by GDAL: GEOGCS["Unknown datum based upon the Clarke 1866 ellipsoid", DATUM["Not specified (based on Clarke 1866 spheroid)", SPHEROID["Clarke 1866",6378206.4,294.9786982138982, AUTHORITY["EPSG","7008"]]], PRIMEM["Greenwich",0], UNIT["degree",0.0174532925199433]] Acknowledgments: We are grateful to the NASA Land Processes Distributed Active Archive Center (LP DAAC) for making the MODIS LST data available. The dataset is based on MODIS Collection V006. File name abbreviations: avg = average of daily averages min = minimum of daily minima max = maximum of daily maxima Meaning of pixel values: The pixel values are coded in degree Celsius * 100 (hence, to obtain °C divide the pixel values by 100.0).
-
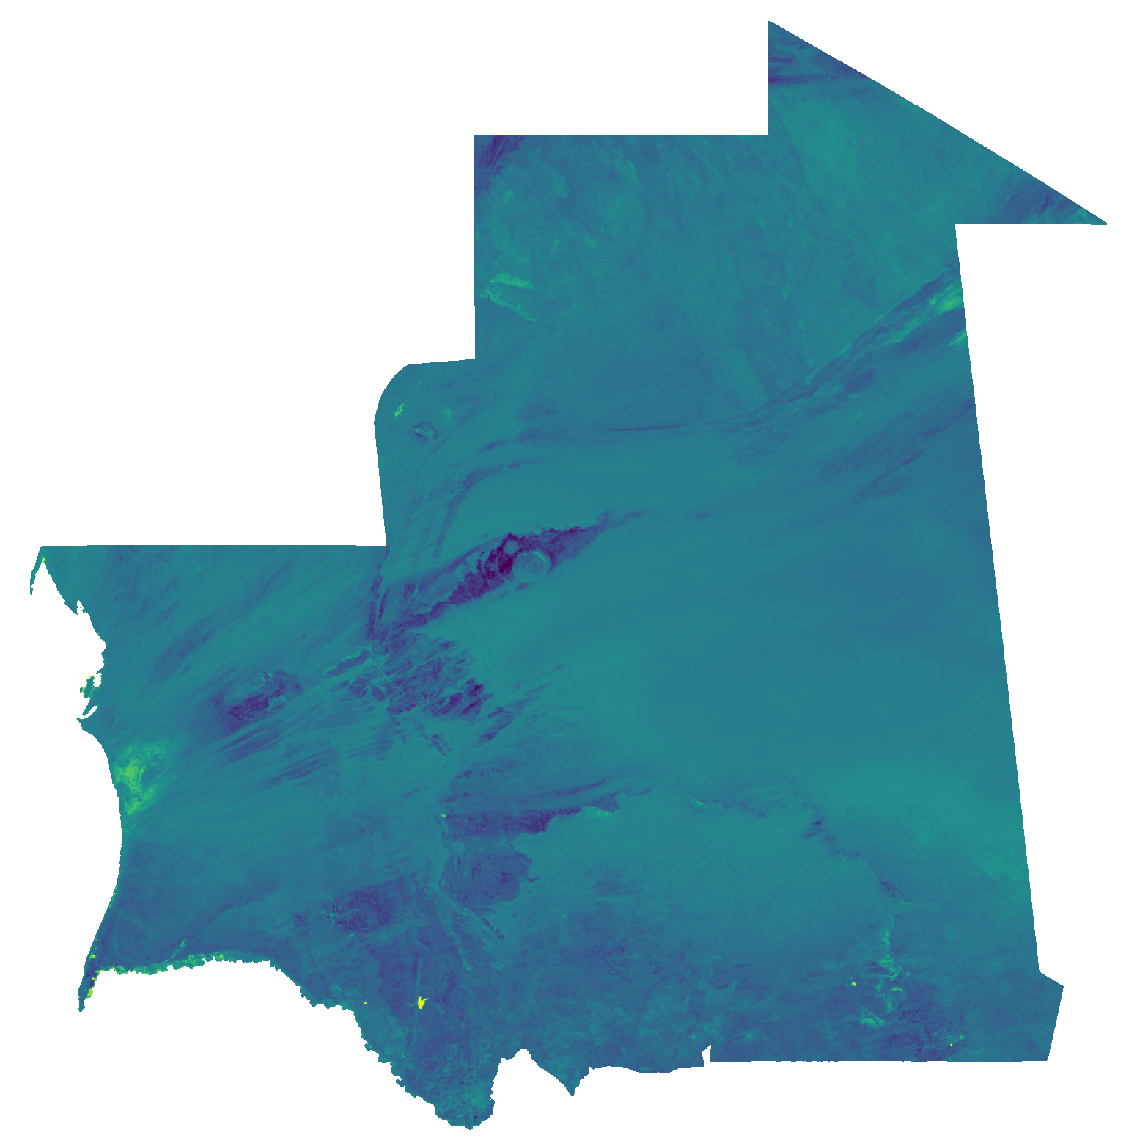
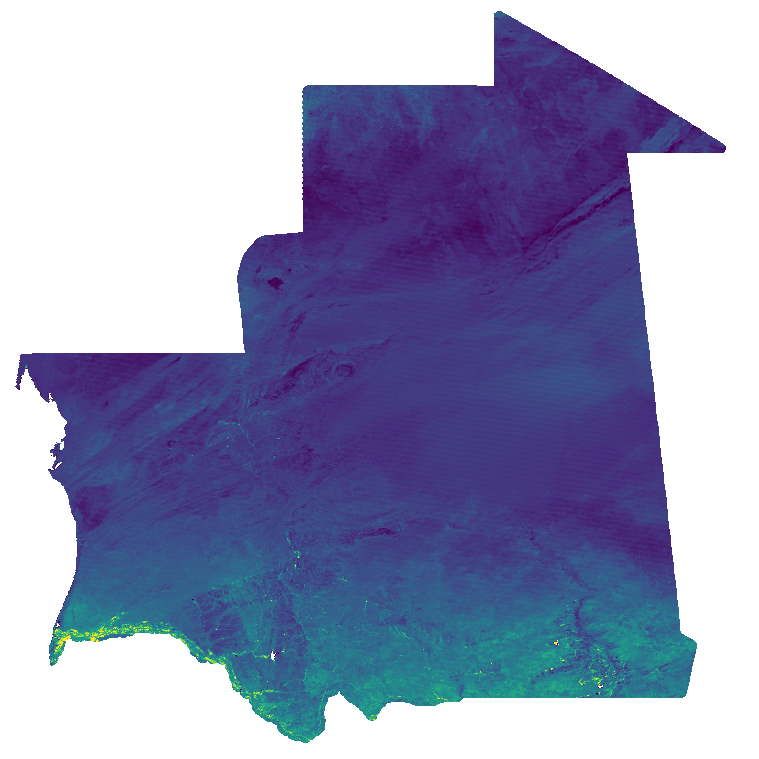
Normalized Difference Water Index (NDWI) from MODIS data for Mauritania at 30 arc seconds (ca. 1000 meter) resolution (2019 - 2023). Source data: - MODIS/Terra Surface Reflectance 8-Day L3 Global 500 m SIN Grid (MOD09A1 v061): https://lpdaac.usgs.gov/products/mod09a1v061/ The Moderate Resolution Imaging Spectroradiometer (MODIS) Terra MOD09A1 Version 6.1 product provides an estimate of the surface spectral reflectance of Terra MODIS Bands 1 through 7 corrected for atmospheric conditions such as gasses, aerosols, and Rayleigh scattering. Along with the seven 500 meter (m) reflectance bands are two quality layers and four observation bands. For each pixel, a value is selected from all the acquisitions within the 8-day composite period. The criteria for the pixel choice include cloud and solar zenith. When several acquisitions meet the criteria the pixel with the minimum channel 3 (blue) value is used. For the time period January 2019 - December 2023, the NDWI has been calculated from the Terra MOD09A1 Version 6.1 product. The layers B02 (near infrared) and B06 (shortwave infrared) of the original data have been processed. Bad quality pixels or pixels with snow/ice and/or cloud cover have been masked using the provided quality assurance (QA) layer. The time series has been gapfilled with a temporal and a spatial approach. Gaps in the time series were filled with a harmonic analysis of time series using six frequencies to also model relatively short-term changes in NDWI. Only missing values were replaced by modelled values. NDWI was calculated as the normalized difference of the bands B02 (near infrared) and B06 (shortwave infrared) with: NDWI = (B02 – B06) / (B02 + B06). This NDWI represents vegetation water content. The 8-day data are then aggregated to monthly temporal resolution using the average and reprojected to Latitude-Longitude/WGS84. File naming: ndwi_monthly_YYYY_MM_30arcsec.tif e.g.: ndwi_monthly_2023_12_30arcsec.tif The date within the filename are year and month of aggregated timestamp. Pixel values: Raster values are in the range [0, 2000]. Real NDWI in the range [-1, 1] can be retrieved with: NDWI = raster_value * 0.001 - 1. Projection + EPSG code: Latitude-Longitude/WGS84 (EPSG: 4326) Spatial extent: north: 28N south: 14N west: 18W east: 4W Temporal extent: January 2019 - December 2023 Spatial resolution: 30 arc seconds (approx. 1000 m) Temporal resolution: monthly Software used: GRASS GIS 8.3.2 Format: GeoTIFF Original dataset license: All data products distributed by NASA's Land Processes Distributed Active Archive Center (LP DAAC) are available at no charge. The LP DAAC requests that any author using NASA data products in their work provide credit for the data, and any assistance provided by the LP DAAC, in the data section of the paper, the acknowledgement section, and/or as a reference. The recommended citation for each data product is available on its Digital Object Identifier (DOI) Landing page, which can be accessed through the Search Data Catalog interface. For more information see: https://lpdaac.usgs.gov/products/mod13a2v061/ Processed by: mundialis GmbH & Co. KG, Germany (https://www.mundialis.de/) Contact: mundialis GmbH & Co. KG, info@mundialis.de Acknowledgements: This study was partially funded by EU grant 874850 MOOD. The contents of this publication are the sole responsibility of the authors and don't necessarily reflect the views of the European Commission.
-
Temperature time series with high spatial and temporal resolutions are important for several applications. The new MODIS Land Surface Temperature (LST) collection 6 provides numerous improvements compared to collection 5. However, being remotely sensed data in the thermal range, LST shows gaps in cloud-covered areas. With a novel method [1] we fully reconstructed the daily global MODIS LST products MOD11A1/MYD11A1 (spatial resolution: 1 km). For this, we combined temporal and spatial interpolation, using emissivity and elevation as covariates for the spatial interpolation. Here we provide a time series of these reconstructed LST data aggregated as daily LST maps at overpass time (approx: 01:30 am, 10:30am, 1:30pm 10:30pm). [1] Metz M., Andreo V., Neteler M. (2017): A new fully gap-free time series of Land Surface Temperature from MODIS LST data. Remote Sensing, 9(12):1333. DOI: http://dx.doi.org/10.3390/rs9121333 The data are provided in GeoTIFF format. The Coordinate Reference System (CRS) is identical to the MOD11A1/MYD11A1 product (Sinusoidal) as provided by NASA. In WKT as reported by GDAL: PROJCRS["unnamed", BASEGEOGCRS["Unknown datum based upon the custom spheroid", DATUM["Not specified (based on custom spheroid)", ELLIPSOID["Custom spheroid",6371007.181,0, LENGTHUNIT["metre",1, ID["EPSG",9001]]]], PRIMEM["Greenwich",0, ANGLEUNIT["degree",0.0174532925199433, ID["EPSG",9122]]]], CONVERSION["unnamed", METHOD["Sinusoidal"], PARAMETER["Longitude of natural origin",0, ANGLEUNIT["degree",0.0174532925199433], ID["EPSG",8802]], PARAMETER["False easting",0, LENGTHUNIT["Meter",1], ID["EPSG",8806]], PARAMETER["False northing",0, LENGTHUNIT["Meter",1], ID["EPSG",8807]]], CS[Cartesian,2], AXIS["easting",east, ORDER[1], LENGTHUNIT["Meter",1]], AXIS["northing",north, ORDER[2], LENGTHUNIT["Meter",1]]] Acknowledgments: We are grateful to the NASA Land Processes Distributed Active Archive Center (LP DAAC) for making the MODIS LST data available. The dataset is based on MODIS Collection V006. Meaning of pixel values: The pixel values are coded in Kelvin * 50 Data type: raster, UInt16 Spatial resolution: 926.62543314 m Spatial extent Sinusoidal (W, S, E, N): 0, 4447802.079066, 2223901.039533, 6671703.118599 Spatial extent in EPSG:4326 (W, S, E, N): 0, 40, 40, 60
-

Northern Italy Land Surface Temperature 1km daily Celsius gap-filled datasetLST daily avg, 2010 - 2018, reconstructed format: GRASS GIS raster format ZLIB compressed stored as a GRASS GIS 7 location/mapset Projection: EU LAEA (EPSG:3035)Reference: Metz, M.; Andreo, V.; Neteler, M. A New Fully Gap-Free Time Series of Land Surface Temperature from MODIS LST Data. Remote Sens. 2017, 9, 1333. https://doi.org/10.3390/rs9121333
-

Overview: The Essential Climate Variables for assessment of climate variability from 1979 to present dataset contains a selection of climatologies, monthly anomalies and monthly mean fields of Essential Climate Variables (ECVs) suitable for monitoring and assessment of climate variability and change. Selection criteria are based on accuracy and temporal consistency on monthly to decadal time scales. The ECV data products in this set have been estimated from climate reanalyses ERA-Interim and ERA5, and, depending on the source, may have been adjusted to account for biases and other known deficiencies. Data sources and adjustment methods used are described in the Product User Guide, as are various particulars such as the baseline periods used to calculate monthly climatologies and the corresponding anomalies. Surface air temperature: This variable is the temperature of air at 2m above the surface of land, sea or in-land waters. 2m temperature is calculated by interpolating between the lowest model level and the Earth's surface, taking account of the atmospheric conditions. Spatial resolution: 0:15:00 (0.25°) Temporal resolution: monthly Temporal extent: 1979 - present Data unit: °C * 10 Data type: Int16 CRS as EPSG: EPSG:4326 Processing time delay: one month
-
Overview: ERA5-Land is a reanalysis dataset providing a consistent view of the evolution of land variables over several decades at an enhanced resolution compared to ERA5. ERA5-Land has been produced by replaying the land component of the ECMWF ERA5 climate reanalysis. Reanalysis combines model data with observations from across the world into a globally complete and consistent dataset using the laws of physics. Reanalysis produces data that goes several decades back in time, providing an accurate description of the climate of the past. Total precipitation: Accumulated liquid and frozen water, including rain and snow, that falls to the Earth's surface. It is the sum of large-scale precipitation (that precipitation which is generated by large-scale weather patterns, such as troughs and cold fronts) and convective precipitation (generated by convection which occurs when air at lower levels in the atmosphere is warmer and less dense than the air above, so it rises). Precipitation variables do not include fog, dew or the precipitation that evaporates in the atmosphere before it lands at the surface of the Earth. This variable is accumulated from the beginning of the forecast time to the end of the forecast step. The units of precipitation are depth in metres. It is the depth the water would have if it were spread evenly over the grid box. Care should be taken when comparing model variables with observations, because observations are often local to a particular point in space and time, rather than representing averages over a model grid box and model time step. The spatially enhanced daily ERA5-Land data has been aggregated on a weekly basis starting from Saturday for the time period 2016 - 2020. Data available is the weekly average of daily sums and the weekly sum of daily sums of total precipitation. File naming: Average of daily sum: era5_land_prectot_avg_weekly_YYYY_MM_DD.tif Sum of daily sum: era5_land_prectot_sum_weekly_YYYY_MM_DD.tif The date in the file name determines the start day of the week (Saturday). Values are mm * 10. Example: Value 218 = 21.8 mm
-
Normalized Difference Vegetation Index (NDVI) from MODIS data for Mauritania at 30 arc seconds (ca. 1000 meter) resolution (2019 - 2023). Source data: - MODIS/Terra Vegetation Indices 16-Day L3 Global 1 km SIN Grid (MOD13A2 v061): https://lpdaac.usgs.gov/products/mod13a2v061/ The Terra Moderate Resolution Imaging Spectroradiometer (MODIS) Vegetation Indices 16-Day (MOD13A2) Version 6.1 product provides Vegetation Index (VI) values at a per pixel basis at 1 kilometer (km) spatial resolution. There are two primary vegetation layers. The first is the Normalized Difference Vegetation Index (NDVI), which is referred to as the continuity index to the existing National Oceanic and Atmospheric Administration-Advanced Very High Resolution Radiometer (NOAA-AVHRR) derived NDVI. The second vegetation layer is the Enhanced Vegetation Index (EVI), which has improved sensitivity over high biomass regions. The algorithm for this product chooses the best available pixel value from all the acquisitions from the 16 day period. The criteria used is low clouds, low view angle and the highest NDVI/EVI value. For the time period January 2019 - December 2023, the NDVI layer of the original data has been processed. Bad quality pixels or pixels with snow/ice and/or cloud cover have been masked using the provided quality assurance (QA) layers and appear as "no data". These 16-Day data are then aggregated to monthly temporal resolution using the maximum and reprojected to Latitude-Longitude/WGS84. File naming: ndvi_filt_YYYY_MM_01T00_00_00.tif e.g.: ndvi_filt_2023_12_01T00_00_00.tif The date within the filename is year and month of aggregated timestamp. Pixel values: NDVI * 10000 Scaled to Integer, example: value 6473 = 0.6473 Projection + EPSG code: Latitude-Longitude/WGS84 (EPSG: 4326) Spatial extent: north: 28N south: 14N west: 18W east: 4W Temporal extent: January 2019 - December 2023 Spatial resolution: 30 arc seconds (approx. 1000 m) Temporal resolution: monthly Software used: GRASS GIS 8.3.2 Format: GeoTIFF Original dataset license: All data products distributed by NASA's Land Processes Distributed Active Archive Center (LP DAAC) are available at no charge. The LP DAAC requests that any author using NASA data products in their work provide credit for the data, and any assistance provided by the LP DAAC, in the data section of the paper, the acknowledgement section, and/or as a reference. The recommended citation for each data product is available on its Digital Object Identifier (DOI) Landing page, which can be accessed through the Search Data Catalog interface. For more information see: https://lpdaac.usgs.gov/products/mod13a2v061/ Processed by: mundialis GmbH & Co. KG, Germany (https://www.mundialis.de/) Contact: mundialis GmbH & Co. KG, info@mundialis.de Acknowledgements: This study was partially funded by EU grant 874850 MOOD. The contents of this publication are the sole responsibility of the authors and don't necessarily reflect the views of the European Commission.
-

When a natural disaster or disease outbreak occurs there is a rush to establish accurate health care location data that can be used to support people on the ground. This has been demonstrated by events such as the Haiti earthquake and the Ebola epidemic in West Africa. As a result valuable time is wasted establishing accurate and accessible baseline data. Healthsites.io establishes this data and the tools necessary to upload, manage and make the data easily accessible. Global scope The Global Healthsites Mapping Project is an initiative to create an online map of every health facility in the world and make the details of each location easily accessible. Open data collaboration Through collaborations with users, trusted partners and OpenStreetMap the Global Healthsites Mapping Project will capture and validate the location and contact details of every facility and make this data freely available under an Open Data License (ODBL). Accessible The Global Healthsites Mapping Project will make the data accessible over the Internet through an API and other formats such as GeoJSON, Shapefile, KML, CSV. Focus on health care location data The Global Healthsites Mapping Project's design philosophy is the long term curation and validation of health care location data. The healthsites.io map will enable users to discover what healthcare facilities exist at any global location and the associated services and resources.