 Open Data Science Europe Metadata Catalog
Human health and safety
Type of resources
Available actions
Topics
Keywords
Contact for the resource
Provided by
Years
Formats
Representation types
Update frequencies
status
Scale
Resolution
-

The Earth Observations Group (EOG) is producing a version 1 suite of average radiance composite images using nighttime data from the Visible Infrared Imaging Radiometer Suite (VIIRS) Day/Night Band (DNB). Prior to averaging, the DNB data is filtered to exclude data impacted by stray light, lightning, lunar illumination, and cloud-cover. Cloud-cover is determined using the VIIRS Cloud Mask product (VCM). In addition, data near the edges of the swath are not included in the composites (aggregation zones 29-32). Temporal averaging is done on a monthly and annual basis. The version 1 series of monthly composites has not been filtered to screen out lights from aurora, fires, boats, and other temporal lights. However, the annual composites have layers with additional separation, removing temporal lights and background (non-light) values. The version 1 products span the globe from 75N latitude to 65S. The products are produced in 15 arc-second geographic grids and are made available in geotiff format as a set of 6 tiles. The tiles are cut at the equator and each span 120 degrees of latitude. Each tile is actually a set of images containing average radiance values and numbers of available observations. In the monthly composites, there are many areas of the globe where it is impossible to get good quality data coverage for that month. This can be due to cloud-cover, especially in the tropical regions, or due to solar illumination, as happens toward the poles in their respective summer months. Therefore, it is imperative that users of these data utilize the cloud-free observations file and not assume a value of zero in the average radiance image means that no lights were observed. The version 1 monthly series is run globally using two different configurations. The first excludes any data impacted by stray light. The second includes these data if the radiance vales have undergone the stray-light correction procedure (Reference). These two configurations are denoted in the filenames as "vcm" and "vcmsl" respectively. The "vcmsl" version, that includes the stray-light corrected data, will have more data coverage toward the poles, but will be of reduced quality. It is up to the users to determine which set is best for their applications. The annual versions are only made with the “vcm” version, excluding any data impacted by stray light. Filenaming convention: The version 1 composite products have 7 filename fields that are separated by an underscore "_". Internal to each field there can be an additional dash separator "-". These fields are followed by a filename extension. The fields are described below using this example filename: SVDNB_npp_20140501-20140531_global_vcmcfg_v10_c201502061154.avg_rade9 Field 1: VIIRS SDR or Product that made the composite "SVDNB" Field 2: satellite name "npp" Field 3: date range "20140501-20140531" Field 4: ROI "global" Field 5: config shortname "vcmcfg" Field 6: version "v10" is version 1.0 Field 7: creation date/time Extension: avg_rade9 The annual products can have other values for the config shortname (Field 5). They are: "vcm-orm" (VIIRS Cloud Mask - Outlier Removed) This product contains cloud-free average radiance values that have undergone an outlier removal process to filter out fires and other ephemeral lights. "vcm-orm-ntl" (VIIRS Cloud Mask - Outlier Removed - Nighttime Lights) This product contains the "vcm-orm" average, with background (non-lights) set to zero. "vcm-ntl" (VIIRS Cloud Mask - Nighttime Lights) This product contains the "vcm" average, with background (non-lights) set to zero. Data types/formats: To reach the widest community of users, files are delivered in compressed tarballs, each containing a set of 2 geotiffs. Files with extensions "avg_rade9" contain floating point radiance values with units in nanoWatts/cm2/sr. Note that the original DNB radiance values have been multiplied by 1E9. This was done to alleviate issues some software packages were having with the very small numbers in the original units. Files with extension "cf_cvg" are integer counts of the number of cloud-free coverages, or observations, that went in to constructing the average radiance image. Files with extension “cvg” are integer counts of the number of coverages or total observations available (regardless of cloud-cover). Credit: When using the data please credit the product generation to the Earth Observation Group, Payne Institute for Public Policy.
-

This global accessibility map enumerates land-based travel time to the nearest densely-populated area for all areas between 85 degrees north and 60 degrees south for a nominal year 2015. Densely-populated areas are defined as contiguous areas with 1,500 or more inhabitants per square kilometer or a majority of built-up land cover types coincident with a population centre of at least 50,000 inhabitants. This map was produced through a collaboration between the University of Oxford Malaria Atlas Project (MAP), Google, the European Union Joint Research Centre (JRC), and the University of Twente, Netherlands. The underlying datasets used to produce the map, include roads (comprising the first ever global-scale use of Open Street Map and Google roads datasets), railways, rivers, lakes, oceans, topographic conditions (slope and elevation), landcover types, and national borders. These datasets were each allocated a speed or speeds of travel in terms of time to cross each pixel of that type. The datasets were then combined to produce a “friction surface”, a map where every pixel is allocated a nominal overall speed of travel based on the types occurring within that pixel. Least-cost-path algorithms (running in Google Earth Engine and, for high-latitude areas, in R) were used in conjunction with this friction surface to calculate the time of travel from all locations to the nearest city (by travel time). Cities were determined using the high-density-cover product created by the Global Human Settlement Project. Each pixel in the resultant accessibility map thus represents the modeled shortest time from that location to a city. Full Citation D.J. Weiss, A. Nelson, H.S. Gibson, W. Temperley, S. Peedell, A. Lieber, M. Hancher, E. Poyart, S. Belchior, N. Fullman, B. Mappin, U. Dalrymple, J. Rozier, T.C.D. Lucas, R.E. Howes, L.S. Tusting, S.Y. Kang, E. Cameron, D. Bisanzio, K.E. Battle, S. Bhatt, and P.W. Gething. A global map of travel time to cities to assess inequalities in accessibility in 2015. (2018). Nature. doi:10.1038/nature25181.
-
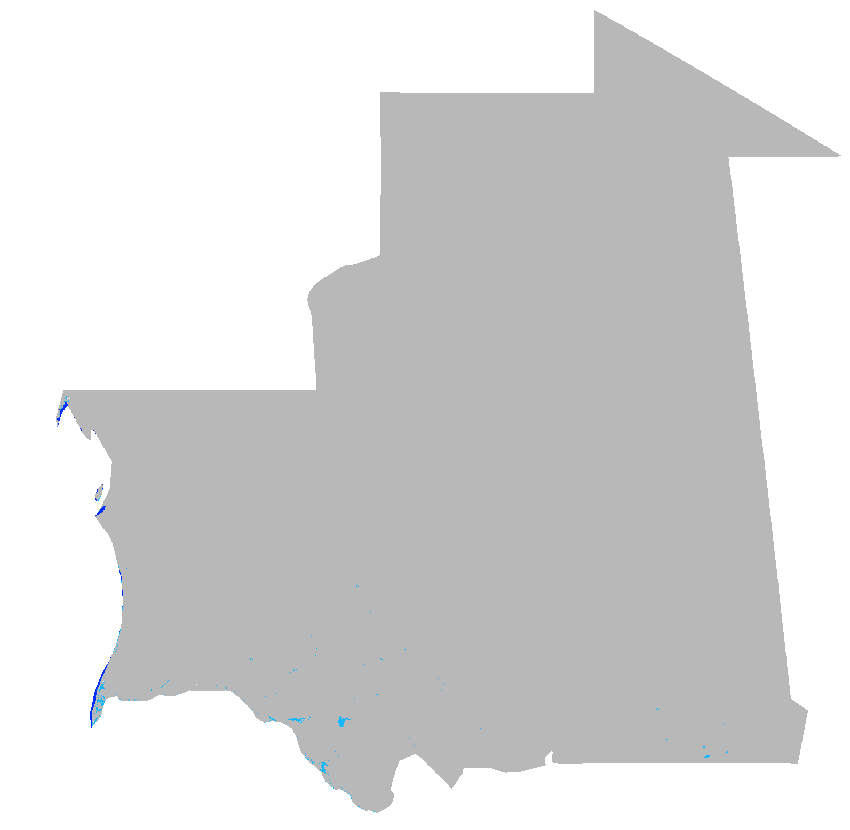
Water Bodies from Copernicus Land Monitoring Service (CLMS) as monthly time series for Mauritania at 30 arc seconds (ca. 1000 meter) resolution (2019 - 2023) Source data: - CLMS: Water Bodies 2014-2020 (raster 300 m), global, 10-daily – version 1: https://land.copernicus.eu/en/products/water-bodies/water-bodies-global-v1-0-300m - CLMS: Water Bodies 2020-present (raster 300 m), global, monthly – version 2: https://land.copernicus.eu/en/products/water-bodies/water-bodies-global-v2-0-300m Water is fundamental to life on Earth. Water quality, including aspects like turbidity and trophic state, is vital for assessing a water body's ecological well-being and its suitability for drinking. Understanding the water's surface temperature is key for monitoring climate change and can influence weather patterns. Tracking water levels in lakes and rivers helps in flood prediction, irrigation planning, and hydroelectric power generation. The presence and extent of ice on lakes and rivers can have significant implications for regional climates, ecosystems, and human activities. Moreover, the surface extent of water bodies, whether permanent or ephemeral, informs land management across various sectors. In an era marked by environmental change, these metrics offer insights into sustainable water resource management. The Water Bodies product group aims to address these critical issues by providing tailored datasets to users which are applicable across a wide array of sectors. It includes Lake Surface Water Temperature, providing real-time and historical data; Lake Water Quality in various resolutions; Water Bodies datasets for surface extent; Lake and River Water Level information; the River and Lake Ice Extent product for ice presence; and the Aggregated River and Lake Ice Extent product, showing percent ice coverage. These products support applications like food security, public health safeguarding, climate studies, and responsible water management practices. Processing steps: To cover the complete time period from 2019 to 2023 two data products of the Water Bodies product group are processed. Up to December of 2020 the Water Bodies at 10-daily resolution have been used, from January 2021 the Water Bodies at monthly resolution have been used. Both original datasets have been downloaded for the area of Mauritania (NUTS MR) within Latitude-Longitude/WGS84 spatial reference system. Then both datasets have been downsampled to 30 arc seconds (ca. 1000 meter) using the most frequent occuring value. The 10-daily data have been aggregated to monthly resolution using the most frequent occurring value. File naming: Until December 2020: c_gls_WB300_GLOBE_PROBAV_V1.0.1_MR_WB_res_YYYY_MM_01T00_00_00.tif e.g.: c_gls_WB300_GLOBE_PROBAV_V1.0.1_MR_WB_res_2020_12_01T00_00_00.tif From January 2021 on: c_gls_WB300_GLOBE_S2_V2.0.1_MR_WB_res_YYYY_MM_01T00_00_00.tif e.g.: c_gls_WB300_GLOBE_S2_V2.0.1_MR_WB_res_2023_12_01T00_00_00.tif The date within the filename is year and month of aggregated timestamp. NOTE: data for 2023-04 are missing, since they are not available from CLMS Pixel values: 0: Sea 70: Water 255: No water Projection + EPSG code: Latitude-Longitude/WGS84 (EPSG: 4326) Spatial extent: north: 27:17:30N south: 14:43:30N west: 17:04:30W east: 04:48:00W Temporal extent: January 2019 - December 2023 (except: April 2023) Spatial resolution: 30 arc seconds (approx. 1000 m) Temporal resolution: monthly Software used: GRASS GIS 8.3.2 Format: GeoTIFF Original dataset license: Generated using European Union's Copernicus Land Monitoring Service information Processed by: mundialis GmbH & Co. KG, Germany (https://www.mundialis.de/) Contact: mundialis GmbH & Co. KG, info@mundialis.de Acknowledgements: This study was partially funded by EU grant 874850 MOOD. The contents of this publication are the sole responsibility of the authors and don't necessarily reflect the views of the European Commission.
-

Regional model ICON-D2 The DWD's ICON-D2 model is a forecast model which is operated for the very-short range up to +27 hours (+45 hours for the 03 UTC run). Due to its fine mesh size, the ICON-D2 especially provides for improved forecasts of hazardous weather conditions, e.g. weather situations with high-level moisture convection (super and multi-cell thunderstorms, squall lines, mesoscale convective complexes) and weather events that are influenced by fine-scale topographic effects (ground fog, Föhn winds, intense downslope winds, flash floods). The model area of ICON-D2 covers the whole German territory, Benelux, Switzerland, Austria and parts of the other neighbouring countries at a horizontal resolution of 2.2 km. In the vertical, the model defines 65 atmosphere levels. The fairly short forecast periods make perfect sense because of the purpose of ICON-D2 (and its small model area). Based on model runs at 00, 06, 09, 12, 15, 18 and 21 UTC, ICON-D2 provides new 27-hour forecasts every 3 hours. The model run at 03 UTC even covers a forecast period of 45 hours. The ICON-D2 forecast data for each weather element are made available in standard packages at our free DWD Open Data Server, both on a rotated grid and on a regular grid. Regional ensemble forecast model ICON-D2 EPS The ensemble forecasting system ICON-D2 EPS is based on the DWD's numerical weather forecast model ICON-D2 and currently includes 20 ensemble members. All ensemble members are calculated at the same horizontal grid spacing as the operational configuration of ICON-D2 (2.2 km). Like ICON-D2, the ICON-D2 EPS ensemble system provides forecasts up to +27 hours for the same model area (up to +45 hours based on the 03 UTC run). For generating the ensemble members, some of the features of the forecasting system are changed. The method currently used to generate the ensemble members involves varying the - lateral boundary conditions - initial state - soil moisture - and model physics. For varying the lateral boundary conditions and the initial state, forecasts from various global models are used. The ICON-D2 EPS is provided on the DWD Open Data Server in the native triangular grid. Note: All previously COSMO-D2 based aviation weather products have been migrated to ICON-D2 on 10.02.2021. However, the familiar design of these products remains unchanged.
-
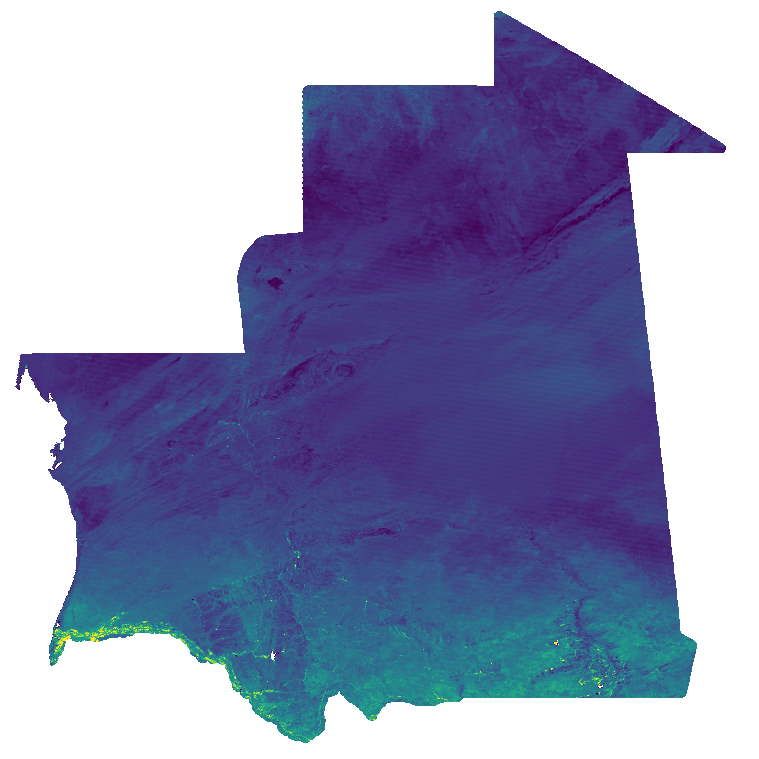
Normalized Difference Vegetation Index (NDVI) from MODIS data for Mauritania at 30 arc seconds (ca. 1000 meter) resolution (2019 - 2023). Source data: - MODIS/Terra Vegetation Indices 16-Day L3 Global 1 km SIN Grid (MOD13A2 v061): https://lpdaac.usgs.gov/products/mod13a2v061/ The Terra Moderate Resolution Imaging Spectroradiometer (MODIS) Vegetation Indices 16-Day (MOD13A2) Version 6.1 product provides Vegetation Index (VI) values at a per pixel basis at 1 kilometer (km) spatial resolution. There are two primary vegetation layers. The first is the Normalized Difference Vegetation Index (NDVI), which is referred to as the continuity index to the existing National Oceanic and Atmospheric Administration-Advanced Very High Resolution Radiometer (NOAA-AVHRR) derived NDVI. The second vegetation layer is the Enhanced Vegetation Index (EVI), which has improved sensitivity over high biomass regions. The algorithm for this product chooses the best available pixel value from all the acquisitions from the 16 day period. The criteria used is low clouds, low view angle and the highest NDVI/EVI value. For the time period January 2019 - December 2023, the NDVI layer of the original data has been processed. Bad quality pixels or pixels with snow/ice and/or cloud cover have been masked using the provided quality assurance (QA) layers and appear as "no data". These 16-Day data are then aggregated to monthly temporal resolution using the maximum and reprojected to Latitude-Longitude/WGS84. File naming: ndvi_filt_YYYY_MM_01T00_00_00.tif e.g.: ndvi_filt_2023_12_01T00_00_00.tif The date within the filename is year and month of aggregated timestamp. Pixel values: NDVI * 10000 Scaled to Integer, example: value 6473 = 0.6473 Projection + EPSG code: Latitude-Longitude/WGS84 (EPSG: 4326) Spatial extent: north: 28N south: 14N west: 18W east: 4W Temporal extent: January 2019 - December 2023 Spatial resolution: 30 arc seconds (approx. 1000 m) Temporal resolution: monthly Software used: GRASS GIS 8.3.2 Format: GeoTIFF Original dataset license: All data products distributed by NASA's Land Processes Distributed Active Archive Center (LP DAAC) are available at no charge. The LP DAAC requests that any author using NASA data products in their work provide credit for the data, and any assistance provided by the LP DAAC, in the data section of the paper, the acknowledgement section, and/or as a reference. The recommended citation for each data product is available on its Digital Object Identifier (DOI) Landing page, which can be accessed through the Search Data Catalog interface. For more information see: https://lpdaac.usgs.gov/products/mod13a2v061/ Processed by: mundialis GmbH & Co. KG, Germany (https://www.mundialis.de/) Contact: mundialis GmbH & Co. KG, info@mundialis.de Acknowledgements: This study was partially funded by EU grant 874850 MOOD. The contents of this publication are the sole responsibility of the authors and don't necessarily reflect the views of the European Commission.
-

CAMS produces specific daily air quality analyses and forecasts for the European domain at significantly higher spatial resolution (0.1 degrees, approx. 10km) than is available from the global analyses and forecasts. Variables: Ammonia, Birch pollen, Carbon monoxide, Dust, Grass pollen, Nitrogen dioxide, Nitrogen monoxide, Non-methane VOCs, Olive pollen, Ozone, Particulate matter d < 10 µm (PM10), Particulate matter d < 10 µm - wildfires only, Particulate matter d < 2.5 µm (PM2.5), Particulate matter d < 2.5 µm - anthropogenic fossil fuel carbon only, Particulate matter d < 2.5 µm - anthropogenic wood burning carbon only, Peroxyacyl nitrates, Ragweed pollen, Secondary inorganic aerosol, Sulphur dioxide
-
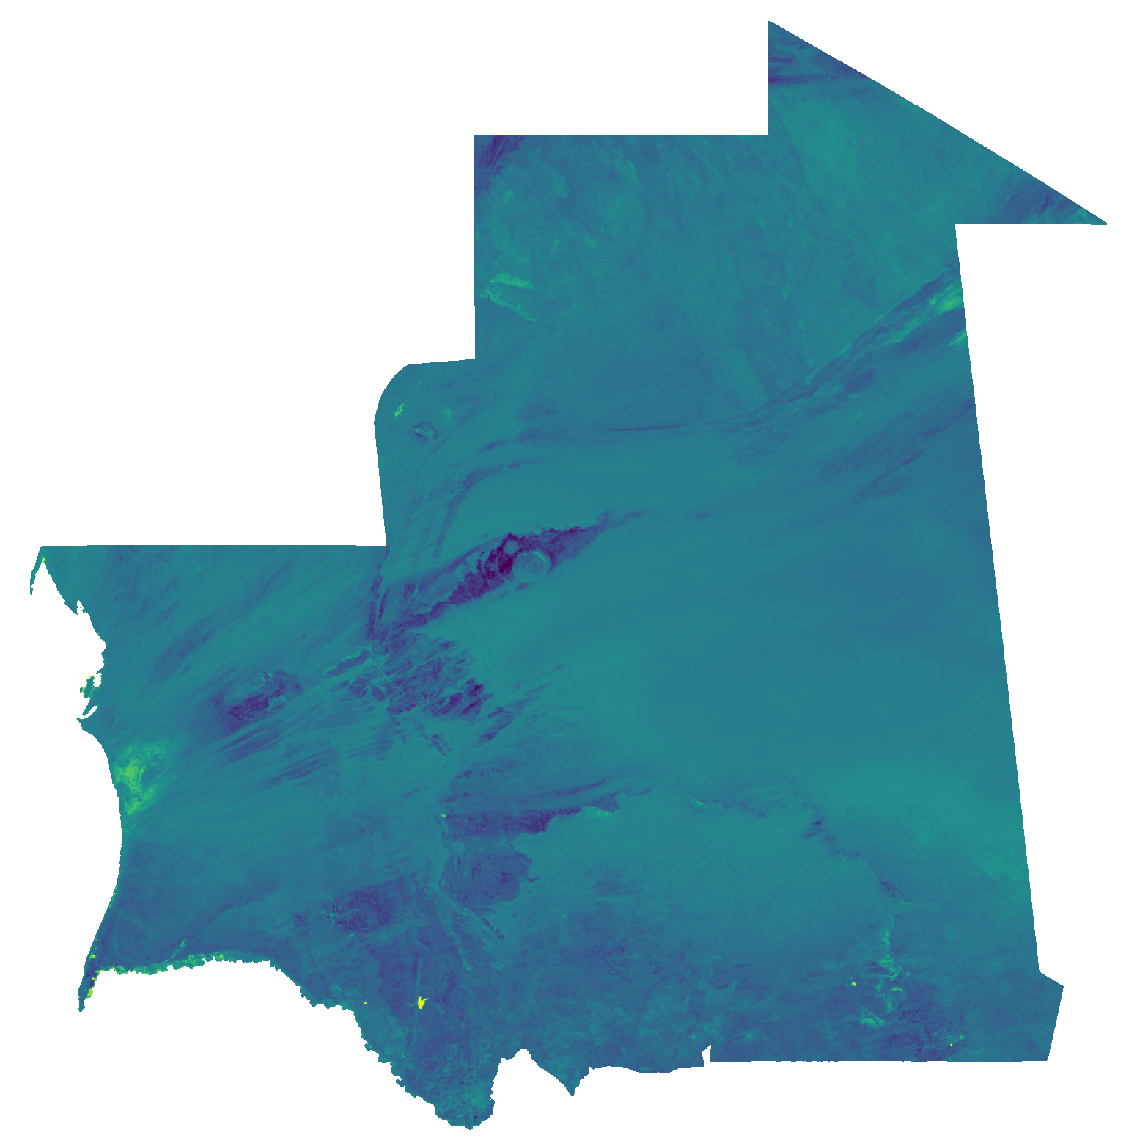
Normalized Difference Water Index (NDWI) from MODIS data for Mauritania at 30 arc seconds (ca. 1000 meter) resolution (2019 - 2023). Source data: - MODIS/Terra Surface Reflectance 8-Day L3 Global 500 m SIN Grid (MOD09A1 v061): https://lpdaac.usgs.gov/products/mod09a1v061/ The Moderate Resolution Imaging Spectroradiometer (MODIS) Terra MOD09A1 Version 6.1 product provides an estimate of the surface spectral reflectance of Terra MODIS Bands 1 through 7 corrected for atmospheric conditions such as gasses, aerosols, and Rayleigh scattering. Along with the seven 500 meter (m) reflectance bands are two quality layers and four observation bands. For each pixel, a value is selected from all the acquisitions within the 8-day composite period. The criteria for the pixel choice include cloud and solar zenith. When several acquisitions meet the criteria the pixel with the minimum channel 3 (blue) value is used. For the time period January 2019 - December 2023, the NDWI has been calculated from the Terra MOD09A1 Version 6.1 product. The layers B02 (near infrared) and B06 (shortwave infrared) of the original data have been processed. Bad quality pixels or pixels with snow/ice and/or cloud cover have been masked using the provided quality assurance (QA) layer. The time series has been gapfilled with a temporal and a spatial approach. Gaps in the time series were filled with a harmonic analysis of time series using six frequencies to also model relatively short-term changes in NDWI. Only missing values were replaced by modelled values. NDWI was calculated as the normalized difference of the bands B02 (near infrared) and B06 (shortwave infrared) with: NDWI = (B02 – B06) / (B02 + B06). This NDWI represents vegetation water content. The 8-day data are then aggregated to monthly temporal resolution using the average and reprojected to Latitude-Longitude/WGS84. File naming: ndwi_monthly_YYYY_MM_30arcsec.tif e.g.: ndwi_monthly_2023_12_30arcsec.tif The date within the filename are year and month of aggregated timestamp. Pixel values: Raster values are in the range [0, 2000]. Real NDWI in the range [-1, 1] can be retrieved with: NDWI = raster_value * 0.001 - 1. Projection + EPSG code: Latitude-Longitude/WGS84 (EPSG: 4326) Spatial extent: north: 28N south: 14N west: 18W east: 4W Temporal extent: January 2019 - December 2023 Spatial resolution: 30 arc seconds (approx. 1000 m) Temporal resolution: monthly Software used: GRASS GIS 8.3.2 Format: GeoTIFF Original dataset license: All data products distributed by NASA's Land Processes Distributed Active Archive Center (LP DAAC) are available at no charge. The LP DAAC requests that any author using NASA data products in their work provide credit for the data, and any assistance provided by the LP DAAC, in the data section of the paper, the acknowledgement section, and/or as a reference. The recommended citation for each data product is available on its Digital Object Identifier (DOI) Landing page, which can be accessed through the Search Data Catalog interface. For more information see: https://lpdaac.usgs.gov/products/mod13a2v061/ Processed by: mundialis GmbH & Co. KG, Germany (https://www.mundialis.de/) Contact: mundialis GmbH & Co. KG, info@mundialis.de Acknowledgements: This study was partially funded by EU grant 874850 MOOD. The contents of this publication are the sole responsibility of the authors and don't necessarily reflect the views of the European Commission.
-
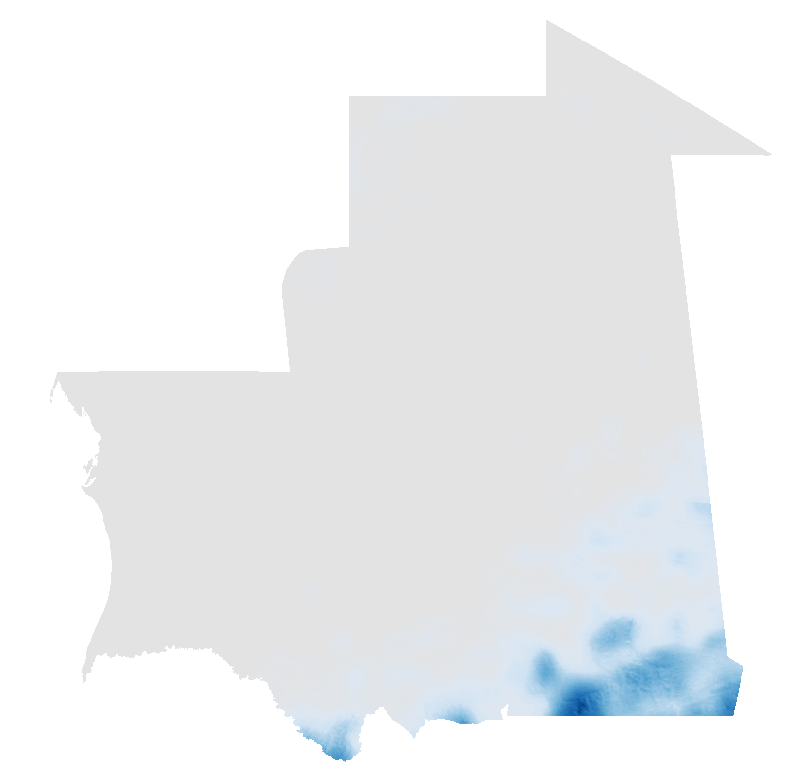
ERA5-Land total precipitation monthly time series for Mauritania at 30 arc seconds (ca. 1000 meter) resolution (2019 - 2023) Source data: ERA5-Land is a reanalysis dataset providing a consistent view of the evolution of land variables over several decades at an enhanced resolution compared to ERA5. ERA5-Land has been produced by replaying the land component of the ECMWF ERA5 climate reanalysis. Reanalysis combines model data with observations from across the world into a globally complete and consistent dataset using the laws of physics. Reanalysis produces data that goes several decades back in time, providing an accurate description of the climate of the past. Total precipitation: Accumulated liquid and frozen water, including rain and snow, that falls to the Earth's surface. It is the sum of large-scale precipitation (that precipitation which is generated by large-scale weather patterns, such as troughs and cold fronts) and convective precipitation (generated by convection which occurs when air at lower levels in the atmosphere is warmer and less dense than the air above, so it rises). Precipitation variables do not include fog, dew or the precipitation that evaporates in the atmosphere before it lands at the surface of the Earth. This variable is accumulated from the beginning of the forecast time to the end of the forecast step. The units of precipitation are depth in metres. It is the depth the water would have if it were spread evenly over the grid box. Care should be taken when comparing model variables with observations, because observations are often local to a particular point in space and time, rather than representing averages over a model grid box and model time step. Processing steps: The original hourly ERA5-Land data has been spatially enhanced from 0.1 degree to 30 arc seconds (approx. 1000 m) spatial resolution by image fusion with CHELSA data (V1.2) (https://chelsa-climate.org/). For each day we used the corresponding monthly long-term average of CHELSA. The aim was to use the fine spatial detail of CHELSA and at the same time preserve the general regional pattern and fine temporal detail of ERA5-Land. The steps included aggregation and enhancement, specifically: 1. spatially aggregate CHELSA to the resolution of ERA5-Land 2. calculate proportion of ERA5-Land / aggregated CHELSA 3. interpolate proportion with a Gaussian filter to 30 arc seconds 4. multiply the interpolated proportions with CHELSA Using proportions ensures that areas without precipitation remain areas without precipitation. Only if there was actual precipitation in a given area, precipitation was redistributed according to the spatial detail of CHELSA. The spatially enhanced daily ERA5-Land data has been aggregated to monthly resolution, by calculating the sum of the precipitation per pixel over each month. File naming: ERA5_land_monthly_prectot_sum_30sec_YYYY_MM_01T00_00_00_int.tif e.g.:ERA5_land_monthly_prectot_sum_30sec_2023_12_01T00_00_00_int.tif The date within the filename is year and month of aggregated timestamp. Pixel values: mm * 10 Scaled to Integer, example: value 218 = 21.8 mm Projection + EPSG code: Latitude-Longitude/WGS84 (EPSG: 4326) Spatial extent: north: 28:18N south: 14:42N west: 17:05W east: 4:49W Temporal extent: January 2019 - December 2023 Spatial resolution: 30 arc seconds (approx. 1000 m) Temporal resolution: monthly Lineage: Dataset has been processed from original Copernicus Climate Data Store (ERA5-Land) data sources. As auxiliary data CHELSA climate data has been used. Software used: GRASS GIS 8.3.2 Format: GeoTIFF Original ERA5-Land dataset license: https://cds.climate.copernicus.eu/api/v2/terms/static/licence-to-use-copernicus-products.pdf CHELSA climatologies (V1.2): Data used: Karger D.N., Conrad, O., Böhner, J., Kawohl, T., Kreft, H., Soria-Auza, R.W., Zimmermann, N.E, Linder, H.P., Kessler, M. (2018): Data from: Climatologies at high resolution for the earth's land surface areas. Dryad digital repository. http://dx.doi.org/doi:10.5061/dryad.kd1d4 Original peer-reviewed publication: Karger, D.N., Conrad, O., Böhner, J., Kawohl, T., Kreft, H., Soria-Auza, R.W., Zimmermann, N.E., Linder, P., Kessler, M. (2017): Climatologies at high resolution for the Earth land surface areas. Scientific Data. 4 170122. https://doi.org/10.1038/sdata.2017.122 Representation type: Grid Processed by: mundialis GmbH & Co. KG, Germany (https://www.mundialis.de/) Contact: mundialis GmbH & Co. KG, info@mundialis.de Acknowledgements: This study was partially funded by EU grant 874850 MOOD. The contents of this publication are the sole responsibility of the authors and don't necessarily reflect the views of the European Commission.
-

Land Surface Temperature (LST) from MODIS data for Mauritania at 30 arc seconds (ca. 1000 meter) resolution (2019 - 2023). Source data: - MODIS/Terra Land Surface Temperature/Emissivity 8-Day L3 Global 1 km SIN Grid (MOD11A2 v061): https://lpdaac.usgs.gov/products/mod11a2v061/ The Terra Moderate Resolution Imaging Spectroradiometer (MODIS) Land Surface Temperature/Emissivity 8-Day (MOD11A2) Version 6.1 product provides an average 8-day per-pixel Land Surface Temperature and Emissivity (LST&E) with a 1 kilometer (km) spatial resolution in a 1,200 by 1,200 km grid. Each pixel value in the MOD11A2 is a simple average of all the corresponding MOD11A1 LST pixels collected within that 8-day period. The 8-day compositing period was chosen because twice that period is the exact ground track repeat period of the Terra and Aqua platforms. For the time period January 2019 - December 2023, the LST layer of the original data has been processed. Both day (10:30 am) and night (10:30 pm) overpasses have been processed separately. Bad quality pixels or pixels with snow/ice and/or cloud cover have been masked using the provided quality assurance (QA) layers. The time series has been gapfilled with a temporal and a spatial approach. Gaps in the time series were filled with a harmonic analysis of time series using six frequencies to also model relatively short-term changes in LST. Only missing values were replaced by modelled values. The 8-day data are then aggregated to monthly temporal resolution using the average and reprojected to Latitude-Longitude/WGS84. File naming: lst_day/night_monthly_YYYY_MM_30arcsec.tif e.g.: lst_day_monthly_2023_12_30arcsec.tif The date within the filename are year and month of aggregated timestamp. Pixel values: LST * 10 Scaled to Integer, example: value 327 = 32.7 Units are degree Celsius. Projection + EPSG code: Latitude-Longitude/WGS84 (EPSG: 4326) Spatial extent: north: 28N south: 14N west: 18W east: 4W Temporal extent: January 2019 - December 2023 Spatial resolution: 30 arc seconds (approx. 1000 m) Temporal resolution: monthly Software used: GRASS GIS 8.3.2 Format: GeoTIFF Original dataset license: All data products distributed by NASA's Land Processes Distributed Active Archive Center (LP DAAC) are available at no charge. The LP DAAC requests that any author using NASA data products in their work provide credit for the data, and any assistance provided by the LP DAAC, in the data section of the paper, the acknowledgement section, and/or as a reference. The recommended citation for each data product is available on its Digital Object Identifier (DOI) Landing page, which can be accessed through the Search Data Catalog interface. For more information see: https://lpdaac.usgs.gov/products/mod13a2v061/ Processed by: mundialis GmbH & Co. KG, Germany (https://www.mundialis.de/) Contact: mundialis GmbH & Co. KG, info@mundialis.de Acknowledgements: This study was partially funded by EU grant 874850 MOOD. The contents of this publication are the sole responsibility of the authors and don't necessarily reflect the views of the European Commission.
-

Many two-dimensional parameter fields are provided in hourly, daily, and monthly resolution in grib1 format such as pressure, precipitation, temperature, solar radiation, and wind speed components at a height of 10m and 100m. Wind speed and wind direction at different fixed heights between 40m and 200m above ground are provided in netCDF format also in hourly, daily, and monthly resolution.A detailed list of two-and three-dimensional parameters can be found here: https://opendata.dwd.de/climate_environment/REA/ParameterTables.pdf Three-dimensional parameter fields are provided in hourly, daily, and monthly resolution for temperature, specific humidity, wind speed components, and turbulent kinetic energy. For the three-dimensional fields, the lowest 6 COSMO model levels are available. The heights are invariant in time but change with topography. Over the ocean, the lowest 6 model levels correspond to a height of 10m, 35m, 69m, 116m, 178m and 258m. Constant parameters, e.g., the height of the model levels, the model surface, etc., are stored in ftp://opendata.dwd.de/climate_environment/REA/COSMO_REA6/constant/. In addition, the geographical latitudes and longitudes relate to COSMO’s rotated longitude-latitude grid.