 Open Data Science Europe Metadata Catalog
Climatology, meteorology, atmosphere
Type of resources
Available actions
Topics
Keywords
Contact for the resource
Provided by
Formats
Representation types
Update frequencies
status
Scale
Resolution
-

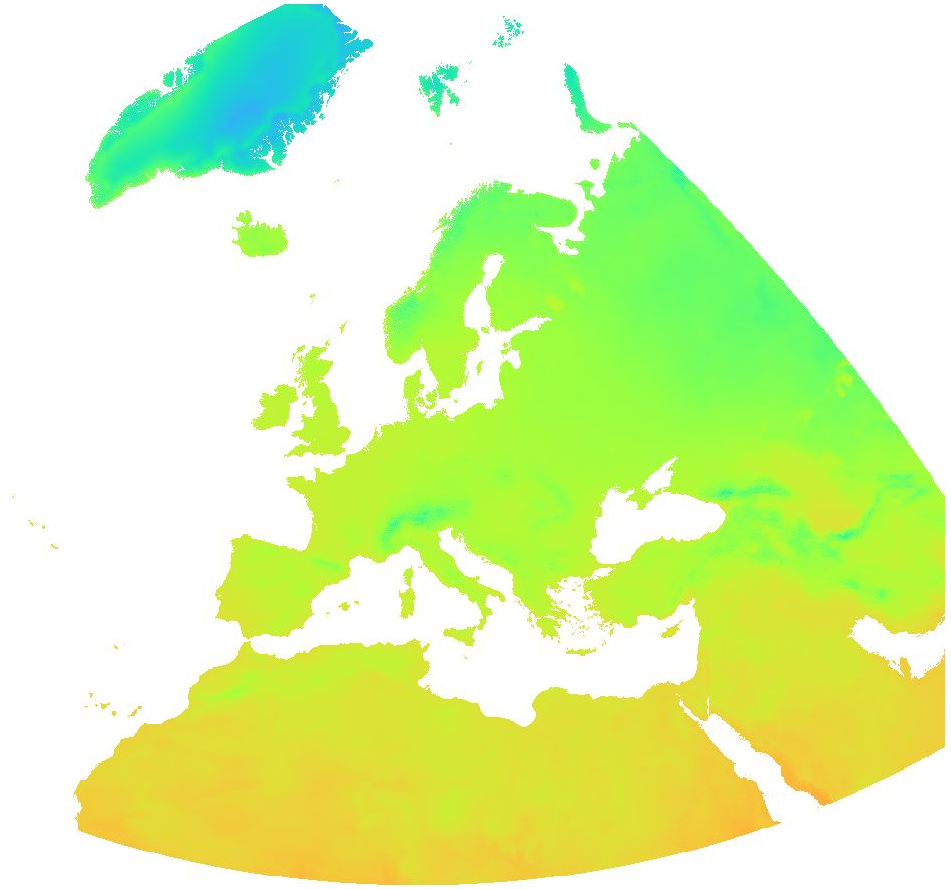
Overview: The Essential Climate Variables for assessment of climate variability from 1979 to present dataset contains a selection of climatologies, monthly anomalies and monthly mean fields of Essential Climate Variables (ECVs) suitable for monitoring and assessment of climate variability and change. Selection criteria are based on accuracy and temporal consistency on monthly to decadal time scales. The ECV data products in this set have been estimated from climate reanalyses ERA-Interim and ERA5, and, depending on the source, may have been adjusted to account for biases and other known deficiencies. Data sources and adjustment methods used are described in the Product User Guide, as are various particulars such as the baseline periods used to calculate monthly climatologies and the corresponding anomalies. Surface air relative humidity: The ratio of the partial pressure of water vapour to the equilibrium vapour pressure of water at the same temperature near the surface. Spatial resolution: 0:15:00 (0.25°) Temporal resolution: monthly Temporal extent: 1979 - present Data unit: percent * 10 Data type: UInt8 CRS as EPSG: EPSG:4326 Processing time delay: one month
-

Regional model ICON-D2 The DWD's ICON-D2 model is a forecast model which is operated for the very-short range up to +27 hours (+45 hours for the 03 UTC run). Due to its fine mesh size, the ICON-D2 especially provides for improved forecasts of hazardous weather conditions, e.g. weather situations with high-level moisture convection (super and multi-cell thunderstorms, squall lines, mesoscale convective complexes) and weather events that are influenced by fine-scale topographic effects (ground fog, Föhn winds, intense downslope winds, flash floods). The model area of ICON-D2 covers the whole German territory, Benelux, Switzerland, Austria and parts of the other neighbouring countries at a horizontal resolution of 2.2 km. In the vertical, the model defines 65 atmosphere levels. The fairly short forecast periods make perfect sense because of the purpose of ICON-D2 (and its small model area). Based on model runs at 00, 06, 09, 12, 15, 18 and 21 UTC, ICON-D2 provides new 27-hour forecasts every 3 hours. The model run at 03 UTC even covers a forecast period of 45 hours. The ICON-D2 forecast data for each weather element are made available in standard packages at our free DWD Open Data Server, both on a rotated grid and on a regular grid. Regional ensemble forecast model ICON-D2 EPS The ensemble forecasting system ICON-D2 EPS is based on the DWD's numerical weather forecast model ICON-D2 and currently includes 20 ensemble members. All ensemble members are calculated at the same horizontal grid spacing as the operational configuration of ICON-D2 (2.2 km). Like ICON-D2, the ICON-D2 EPS ensemble system provides forecasts up to +27 hours for the same model area (up to +45 hours based on the 03 UTC run). For generating the ensemble members, some of the features of the forecasting system are changed. The method currently used to generate the ensemble members involves varying the - lateral boundary conditions - initial state - soil moisture - and model physics. For varying the lateral boundary conditions and the initial state, forecasts from various global models are used. The ICON-D2 EPS is provided on the DWD Open Data Server in the native triangular grid. Note: All previously COSMO-D2 based aviation weather products have been migrated to ICON-D2 on 10.02.2021. However, the familiar design of these products remains unchanged.
-
Overview: ERA5-Land is a reanalysis dataset providing a consistent view of the evolution of land variables over several decades at an enhanced resolution compared to ERA5. ERA5-Land has been produced by replaying the land component of the ECMWF ERA5 climate reanalysis. Reanalysis combines model data with observations from across the world into a globally complete and consistent dataset using the laws of physics. Reanalysis produces data that goes several decades back in time, providing an accurate description of the climate of the past. Surface temperature: Temperature of the surface of the Earth. The skin temperature is the theoretical temperature that is required to satisfy the surface energy balance. It represents the temperature of the uppermost surface layer, which has no heat capacity and so can respond instantaneously to changes in surface fluxes. The spatially enhanced daily ERA5-Land data has been aggregated on a weekly basis (starting from Saturday) for the time period 2016 - 2020. Data available is the weekly average of daily averages, the weekly minimum of daily minima and the weekly maximum of daily maxima of surface temperature. File naming: Average of daily average: era5_land_ts_avg_weekly_YYYY_MM_DD.tif Max of daily max: era5_land_ts_max_weekly_YYYY_MM_DD.tif Min of daily min: era5_land_ts_min_weekly_YYYY_MM_DD.tif The date in the file name determines the start day of the week (Saturday). Values are °C * 10. Example: Value 302 = 30.2 °C The QML or SLD style files can be used for visualization of the temperature layers.
-

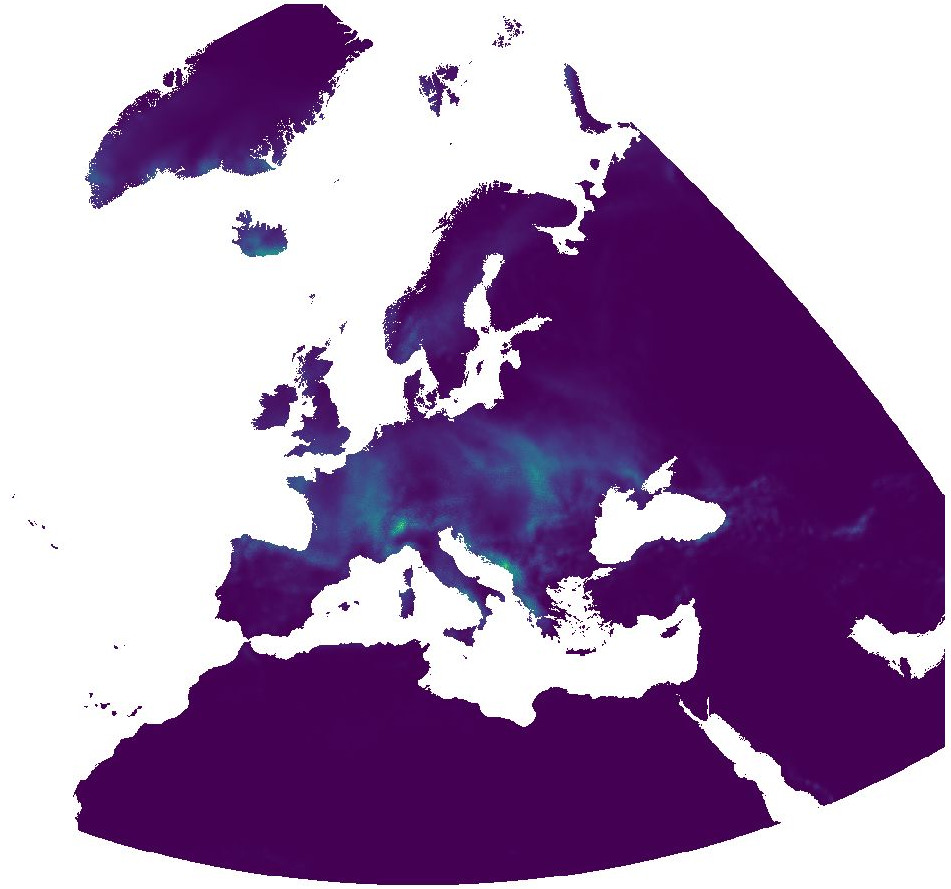
Overview: The Essential Climate Variables for assessment of climate variability from 1979 to present dataset contains a selection of climatologies, monthly anomalies and monthly mean fields of Essential Climate Variables (ECVs) suitable for monitoring and assessment of climate variability and change. Selection criteria are based on accuracy and temporal consistency on monthly to decadal time scales. The ECV data products in this set have been estimated from climate reanalyses ERA-Interim and ERA5, and, depending on the source, may have been adjusted to account for biases and other known deficiencies. Data sources and adjustment methods used are described in the Product User Guide, as are various particulars such as the baseline periods used to calculate monthly climatologies and the corresponding anomalies. Sum of monthly precipitation: This variable is the accumulated liquid and frozen water, including rain and snow, that falls to the Earth's surface. It is the sum of large-scale precipitation (that precipitation which is generated by large-scale weather patterns, such as troughs and cold fronts) and convective precipitation (generated by convection which occurs when air at lower levels in the atmosphere is warmer and less dense than the air above, so it rises). Precipitation variables do not include fog, dew or the precipitation that evaporates in the atmosphere before it lands at the surface of the Earth. Spatial resolution: 0:15:00 (0.25°) Temporal resolution: monthly Temporal extent: 1979 - present Data unit: mm * 10 Data type: UInt32 CRS as EPSG: EPSG:4326 Processing time delay: one month
-

Many two-dimensional parameter fields are provided in hourly, daily, and monthly resolution in grib1 format such as pressure, precipitation, temperature, solar radiation, and wind speed components at a height of 10m and 100m. Wind speed and wind direction at different fixed heights between 40m and 200m above ground are provided in netCDF format also in hourly, daily, and monthly resolution.A detailed list of two-and three-dimensional parameters can be found here: https://opendata.dwd.de/climate_environment/REA/ParameterTables.pdf Three-dimensional parameter fields are provided in hourly, daily, and monthly resolution for temperature, specific humidity, wind speed components, and turbulent kinetic energy. For the three-dimensional fields, the lowest 6 COSMO model levels are available. The heights are invariant in time but change with topography. Over the ocean, the lowest 6 model levels correspond to a height of 10m, 35m, 69m, 116m, 178m and 258m. Constant parameters, e.g., the height of the model levels, the model surface, etc., are stored in ftp://opendata.dwd.de/climate_environment/REA/COSMO_REA6/constant/. In addition, the geographical latitudes and longitudes relate to COSMO’s rotated longitude-latitude grid.
-
Temperature time series with high spatial and temporal resolutions are important for several applications. The new MODIS Land Surface Temperature (LST) collection 6 provides numerous improvements compared to collection 5. However, being remotely sensed data in the thermal range, LST shows gaps in cloud-covered areas. With a novel method [1] we fully reconstructed the daily global MODIS LST products MOD11A1/MYD11A1 (spatial resolution: 1 km). For this, we combined temporal and spatial interpolation, using emissivity and elevation as covariates for the spatial interpolation. Here we provide a time series of these reconstructed LST data aggregated as daily LST maps at overpass time (approx: 01:30 am, 10:30am, 1:30pm 10:30pm). [1] Metz M., Andreo V., Neteler M. (2017): A new fully gap-free time series of Land Surface Temperature from MODIS LST data. Remote Sensing, 9(12):1333. DOI: http://dx.doi.org/10.3390/rs9121333 The data are provided in GeoTIFF format. The Coordinate Reference System (CRS) is identical to the MOD11A1/MYD11A1 product (Sinusoidal) as provided by NASA. In WKT as reported by GDAL: PROJCRS["unnamed", BASEGEOGCRS["Unknown datum based upon the custom spheroid", DATUM["Not specified (based on custom spheroid)", ELLIPSOID["Custom spheroid",6371007.181,0, LENGTHUNIT["metre",1, ID["EPSG",9001]]]], PRIMEM["Greenwich",0, ANGLEUNIT["degree",0.0174532925199433, ID["EPSG",9122]]]], CONVERSION["unnamed", METHOD["Sinusoidal"], PARAMETER["Longitude of natural origin",0, ANGLEUNIT["degree",0.0174532925199433], ID["EPSG",8802]], PARAMETER["False easting",0, LENGTHUNIT["Meter",1], ID["EPSG",8806]], PARAMETER["False northing",0, LENGTHUNIT["Meter",1], ID["EPSG",8807]]], CS[Cartesian,2], AXIS["easting",east, ORDER[1], LENGTHUNIT["Meter",1]], AXIS["northing",north, ORDER[2], LENGTHUNIT["Meter",1]]] Acknowledgments: We are grateful to the NASA Land Processes Distributed Active Archive Center (LP DAAC) for making the MODIS LST data available. The dataset is based on MODIS Collection V006. Meaning of pixel values: The pixel values are coded in Kelvin * 50 Data type: raster, UInt16 Spatial resolution: 926.62543314 m Spatial extent Sinusoidal (W, S, E, N): 0, 4447802.079066, 2223901.039533, 6671703.118599 Spatial extent in EPSG:4326 (W, S, E, N): 0, 40, 40, 60
-

Temperature time series with high spatial and temporal resolutions are important for several applications. The new MODIS Land Surface Temperature (LST) collection 6 provides numerous improvements compared to collection 5. However, being remotely sensed data in the thermal range, LST shows gaps in cloud-covered areas. With a novel method [1] we fully reconstructed the daily global MODIS LST products MOD11C1 and MYD11C1 (spatial resolution: 3 arc-min, i.e. approximately 5.6 km at the equator). For this, we combined temporal and spatial interpolation, using emissivity and elevation as covariates for the spatial interpolation. Here we provide a time series of these reconstructed LST data aggregated as monthly average, minimum and maximum LST maps. [1] Metz M., Andreo V., Neteler M. (2017): A new fully gap-free time series of Land Surface Temperature from MODIS LST data. Remote Sensing, 9(12):1333. DOI: http://dx.doi.org/10.3390/rs9121333 The data available here for download are the reconstructed global MODIS LST products MOD11C1/MYD11C1 at a spatial resolution of 3 arc-min (approximately 5.6 km at the equator; see https://lpdaac.usgs.gov/dataset_discovery/modis/modis_products_table), aggregated to monthly data. The data are provided in GeoTIFF format. The Coordinate Reference System (CRS) is identical to the MOD11C1/MYD11C1 product as provided by NASA. In WKT as reported by GDAL: GEOGCS["Unknown datum based upon the Clarke 1866 ellipsoid", DATUM["Not specified (based on Clarke 1866 spheroid)", SPHEROID["Clarke 1866",6378206.4,294.9786982138982, AUTHORITY["EPSG","7008"]]], PRIMEM["Greenwich",0], UNIT["degree",0.0174532925199433]] Acknowledgments: We are grateful to the NASA Land Processes Distributed Active Archive Center (LP DAAC) for making the MODIS LST data available. The dataset is based on MODIS Collection V006. File name abbreviations: avg = average of daily averages min = minimum of daily minima max = maximum of daily maxima Meaning of pixel values: The pixel values are coded in degree Celsius * 100 (hence, to obtain °C divide the pixel values by 100.0).
-
Overview: ERA5-Land is a reanalysis dataset providing a consistent view of the evolution of land variables over several decades at an enhanced resolution compared to ERA5. ERA5-Land has been produced by replaying the land component of the ECMWF ERA5 climate reanalysis. Reanalysis combines model data with observations from across the world into a globally complete and consistent dataset using the laws of physics. Reanalysis produces data that goes several decades back in time, providing an accurate description of the climate of the past. Total precipitation: Accumulated liquid and frozen water, including rain and snow, that falls to the Earth's surface. It is the sum of large-scale precipitation (that precipitation which is generated by large-scale weather patterns, such as troughs and cold fronts) and convective precipitation (generated by convection which occurs when air at lower levels in the atmosphere is warmer and less dense than the air above, so it rises). Precipitation variables do not include fog, dew or the precipitation that evaporates in the atmosphere before it lands at the surface of the Earth. This variable is accumulated from the beginning of the forecast time to the end of the forecast step. The units of precipitation are depth in metres. It is the depth the water would have if it were spread evenly over the grid box. Care should be taken when comparing model variables with observations, because observations are often local to a particular point in space and time, rather than representing averages over a model grid box and model time step. The spatially enhanced daily ERA5-Land data has been aggregated on a weekly basis starting from Saturday for the time period 2016 - 2020. Data available is the weekly average of daily sums and the weekly sum of daily sums of total precipitation. File naming: Average of daily sum: era5_land_prectot_avg_weekly_YYYY_MM_DD.tif Sum of daily sum: era5_land_prectot_sum_weekly_YYYY_MM_DD.tif The date in the file name determines the start day of the week (Saturday). Values are mm * 10. Example: Value 218 = 21.8 mm
-

CHELSA V1.2 (http://chelsa-climate.org/) is a high resolution (30 arc sec, ~1 km) climate data set for the earth land surface areas. It includes monthly and annual mean temperature and precipitation patterns for the time period 1979-2013. Methods are described in http://chelsa-climate.org/wp-admin/download-page/CHELSA_tech_specification.pdf. CHELSA Version 1.2 is licensed under a Creative Commons Attribution 4.0 International License. Specifications: High resolution (30 arcsec, ~1 km) Precipitation & Temperature Climatologies for the years 1979 – 2013 Incorporation of topoclimate (e.g. orographic rainfall & wind fields). All products of CHELSA are in a geographic coordinate system referenced to the WGS 84 horizontal datum, with the horizontal coordinates expressed in decimal degrees. The CHELSA layer extents (minimum and maximum latitude and longitude) are a result of the coordinate system inherited from the 1-arc-second GMTED2010 data which itself inherited the grid extent from the 1-arc-second SRTM data. Note that because of the pixel center referencing of the input GMTED2010 data the full extent of each CHELSA grid as defined by the outside edges of the pixels differs from an integer value of latitude or longitude by 0.000138888888 degree (or 1/2 arc-second). Users of products based on the legacy GTOPO30 product should note that the coordinate referencing of CHELSA (and GMTED2010) and GTOPO30 are not the same. In GTOPO30, the integer lines of latitude and longitude fall directly on the edges of a 30-arc-second pixel. Thus, when overlaying CHELSA with products based on GTOPO30 a slight shift of 1/2 arc-second will be observed between the edges of corresponding 30-arc-second pixels. To redistribute the data, please cite the following peer reviewed articles: <a href="https://www.nature.com/articles/sdata2017122"target=_blank>Karger, D.N., Conrad, O., Böhner, J., Kawohl, T., Kreft, H., Soria-Auza, R.W., Zimmermann, N.E., Linder, H.P. & Kessler, M. (2017) Climatologies at high resolution for the earth’s land surface areas. Scientific Data 4, 170122.</a> <a href="https://doi.org/10.5061/dryad.kd1d4"target=_blank>Karger, D.N., Conrad, O., Böhner, J., Kawohl, T., Kreft, H., Soria-Auza, R.W., Zimmermann, N.E., Linder, H.P., Kessler, M. (2017) Data from: Climatologies at high resolution for the earth’s land surface areas. Dryad Digital Repository. </a>
-

CAMS produces specific daily air quality analyses and forecasts for the European domain at significantly higher spatial resolution (0.1 degrees, approx. 10km) than is available from the global analyses and forecasts. Variables: Ammonia, Birch pollen, Carbon monoxide, Dust, Grass pollen, Nitrogen dioxide, Nitrogen monoxide, Non-methane VOCs, Olive pollen, Ozone, Particulate matter d < 10 µm (PM10), Particulate matter d < 10 µm - wildfires only, Particulate matter d < 2.5 µm (PM2.5), Particulate matter d < 2.5 µm - anthropogenic fossil fuel carbon only, Particulate matter d < 2.5 µm - anthropogenic wood burning carbon only, Peroxyacyl nitrates, Ragweed pollen, Secondary inorganic aerosol, Sulphur dioxide